Introduction to Hydrology and Water Resources
670 likes | 1.75k Views
Introduction to Hydrology and Water Resources Philip B. Bedient Rice University Fall, 2005 Major Hydrologic Processes Precipitation (radar or rain gage) Evaporation or ET (loss to atmosphere) Infiltration (loss to subsurface soils) Overland flow (sheet flow toward nearest stream)

Introduction to Hydrology and Water Resources
E N D
Presentation Transcript
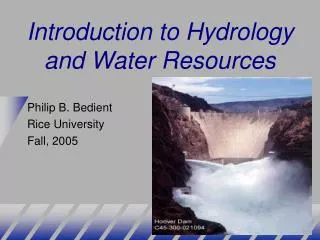
Introduction to Hydrology and Water Resources Philip B. Bedient Rice University Fall, 2005
Major Hydrologic Processes • Precipitation (radar or rain gage) • Evaporation or ET (loss to atmosphere) • Infiltration (loss to subsurface soils) • Overland flow (sheet flow toward nearest stream) • Streamflow (measured flow at stream gage) • Ground water flow in wells • Water quality and contaminant transport
The Hydrologic Cycle P - I - E - T - RO = dS/dt
Major Hydraulic Issues • Energy and momentum principles • Pipe flow and pipe systems • Open channel flow • Flood routing in rivers • Storage discharge relationships • Well mechanics and pumping systems • Contaminant transport modeling
History of Hydrology - 1800s • Originally dates back to early Roman times • Studies done on River Seine in Paris • Darcy and Dupuit laws of ground water - 1850s • USGS first measured Miss River flow in 1888 • Manning’s Eqn - Open Channel Flow - 1889 • U.S. Weather Bureau 1891 (NWS)
1900s Hydrology • Early 1900s saw great expansion of water supply and flood control dams in the western U.S. - in response to Dust Bowl and the Great Depression of the 1930s • U.S. Dept of Agriculture began many hydrologic studies • Sherman unit hydrograph method • Theis well mechanics (1935) • Horton infiltration theory 1940s • Penman (1948) - complete theory of evaporation
Recent History of Hydrology • Great urban expansion in 1950s and 60s - led to demand for better water supply and prediction (after WW II) • EPA formed in 1970 with a mission to clean up the rivers and lakes of America - beginning of environmental science and engineering as we know it today • USGS and EPA actively involved in large-scale sampling programs at the national level - (i.e., The Woodlands, TX) • EPA funded development of computer models to address major water quality issues in streams and lakes, and estuarine bays.
BEGINS: Rainfall on the Basin • Frontal Activity (Cold, Warm) • Convective Summer Storms • Tropical Storms • Hurricanes
Hurricane Ivan Sep 04 • Ivan spawned tornadoes from northern Florida into Georgia and Alabama with 22 deaths reported in Florida. • Waves as high as 50 feet were measured 75 miles south of Dauphin Island from 130-150 mph winds. • Ivan’s devastating march across the tropics after it formed was precisely predicted because a big ridge of high pressure steered it • Created a potential disaster zone of more than 350 miles across.
Hurricane Katrina - $100B in Damages and Loss of Life > 2000
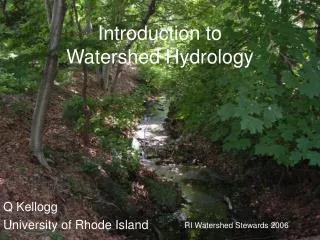
The Watershed or Basin • Area of land that drains to a single outlet and is separated from other watersheds by a drainage divide. • Rainfall that falls in a watershed will generate runoff to that watershed outlet. • Topographic elevation is used to define a watershed boundary (land survey or LIDAR)
Watershed Characteristics • Size • Slope • Shape • Soil type • Storage capacity • Land use / cover Divide Reservoir Natural stream Urban Concrete channel
Trinity River Basin DEMor Digital Elevation Model Discrete Space Representation Continuous Space Representation River reaches and their watersheds Digital Elevation Model 30m cells TNRCC water quality segments and their watersheds
Geographic Information Systems Digital data organized with spatial analysis tools from GIS Datasets linked to map locations
Major Computer Advances • US Army Corps of Engineers Hydrologic Engineering Center (HEC) models - 1970s to the present • EPA in 1970s - Storm Water Mgt Model (SWMM) • EPA currently supports a suite of advanced models for analyzing water quality in streams and lakes • 1980s - FEMA floodplain mapping and the federal flood insurance program - regulate floodplains • 1990s - advances in GIS Modeling and NEXRAD radar, HEC-HMS and HEC-RAS (1995, 1998 releases)
Water Resources Engineering • Water Supply Dams and Reservoirs • Floods and Flood Control - levee systems • Irrigation and Drought Control • Water Distribution Systems • Hydropower & Navigation • Water Quality and Coastal Resources
Water Resources Engineering Examples of Problems AGRICULTURE BIG DAMS WATER QUALITY DROUGHT
Guadalupe River • The Guadalupe River was one of the earliest-explored rivers in Texas • Named for Our Lady of Guadalupe by Spanish explorers in 1689 • The name Guadalupe, or Nuestra Señora de Guadalupe, has been applied to the present river • One of most beautiful in TX
Guadalupe River Facts • The Guadalupe River valley artifacts suggest that the area has supported human habitation for several thousand years. • The steady flow from the springs that feed the Guadalupe and its tributaries have made the river an attractive recreational source. • Major water supply from Canyon Lake • May become major source for San Antonio - in the near future
Mansfield Dam - Lake Travis • Mansfield Dam sits across a canyon at Marshall Ford on the Colorado River west of Austin, Texas • Built from 1937 to 1941 • Named in 1941 in honor of U.S. Representative J.J. Mansfield • Created a 50 mile long lake Travis that is hundreds of feet deep in lower end
HARRIS COUNTY WATERSHEDS White Oak Addicks Buffalo Downtown Barker Brays
Galveston Bay • Receives runoff from two major river systems • Subject to serious water quality and fresh water issues • Major port for Galveston and Houston
Dam Builders came in 1931 finished in 1935 • The building of the Hoover Dam meant jobs for many people (16,000 workers) • 96 men were killed in industrial accidents while building the Dam, dozens of others from heat, carbon monoxide poisoning, polluted water, or disease
Hoover Dam Facts • Hoover Dam is a testimony to a country's ability to construct a major engineering project in the midst of adverse conditions • It took less than 5 years, in a harsh and barren land, to build the largest dam of its time • The dam is a National Historic Landmark and has been rated by the American Society of Civil Engineers as one of America's Seven Modern Civil Engineering Wonders
Glen Canyon Dam - 1965 • The Glen Canyon Dam is one of the last large built dams in the United States - Upper Colorado River • Under the Colorado River Storage Project, the Glen Canyon Dam and Lake Powell would form the primary storage unit for the area • Created a major environmental fight over large dams in west
Water Resources Problems • Severe weather impacts - hurricanes & trop storms • Streamflow and major flood devastation • Overall water supply - local and regional scales • Water quality impacts on streams, lakes, bays • Watershed management for urban development • Irrigation for agricultural areas - GW impacts • Maintaining delicate aquatic ecosystems • Water supplies for developing countries
Environmental Hydrology • Surface water supply and delivery systems (sewers) • Ground water for supply, wells, and springs • Contamination and environmental quality issue • Lake and Coastal Bay quality studies • River quality for drinking water and recreation • Hazardous waste studies for GW contamination • Waste sources from urban/industrial runoff • Land use impacts from urban development • Disaster mitigation and flood control
New Technology has Revolutionized Hydrology • High Speed Digital Computation • Geographical Information Systems (GIS) • Large Hydrologic and Meteorologic Databases • GPS and LIDAR methods for ground surveys • RADAR rainfall estimates from NEXRAD • Advanced forecasting tools for severe weather and flood Alert
Hydrologic Theory • One of the principal objectives in hydrology is to transform rainfall that has fallen over a watershed area into flows to be expected in the receiving stream. • Losses must be considered such as infiltration or evaporation (long-term) • Watershed characteristics are important
Design Rainfalls • Design Storm from HCFCD and NWS • Based on Statistical Analysis of Data • 5, 10, 25, 50, 100 Year Events • Various Durations
RADAR Rainfall Estimates • NEXRAD provides real-time data on a ~16 km2 (6 mi2) grid • Equivalent to about 21 rain gages in Brays Bayou watershed • Each estimate represents an average rainfall amount over the entire 4 x 4 km2 area • NEXRAD rainfall estimates compare well with point rain gage measurements (r2 ~ 0.9)
FAS – NEXRAD Midnight 1 a.m.
Unit Hydrograph Theory • The unit hydrograph represents the basin response to 1 inch (1 cm) of uniform net rainfall for a specified duration. • Linear method originally devised in 1932. • Works best for relatively small subareas - in the range of 1 to 10 sq miles. • Several computational methods exist.
Loss Rate Method:Initial and Uniform Loss Rate Method • Initial Amount Lost to Infiltration (in) Soil is Saturated. • Uniform Loss at a Constant Rate (in/hr) Inches/Hour Example: Initial Loss = 0.5 in, Uniform Loss = 0.05 in/hr
NET RF Multi-Period Storm UH • Pg - Inf = Net Rainfall • Adjust UH by Net RF • Add and Lag UH • Compute Storm • Hydrograph STORM