Electrocorticography -Based Brain Computer Interface – The Seattle Experience
150 likes | 316 Views
Electrocorticography -Based Brain Computer Interface – The Seattle Experience. Rough Comparison. Task. Control vertical position of cursor to hit the target. Horizontal Speed = 1 screen width / 5.5 seconds. Task Interface. Decoder. Output (25 Hz): “up” or “down” magnitude.

Electrocorticography -Based Brain Computer Interface – The Seattle Experience
E N D
Presentation Transcript
Electrocorticography-Based Brain Computer Interface – The Seattle Experience
Task Control vertical position of cursor to hit the target Horizontal Speed = 1 screen width / 5.5 seconds
Task Interface Decoder • Output (25 Hz): • “up” or “down” • magnitude Input (1,000 Hz): - 64 ECoG electrodes Visual feedback Human User
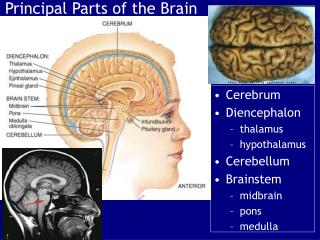
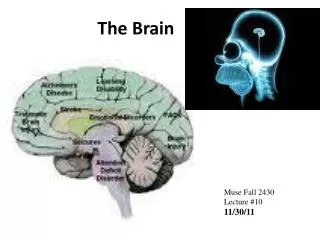
System Overview • ECoG electrode placement • Decoding • Learning (Model) • Experiment
Decoding • For each user U and user action A • Feature functions f(x) • Feature weights w • Output is linear combination of feature functions • How to choose features? • How to weight features?
Feature Selection Rest state Action state
Feature Selection + Learning • Training data = <signal, action state> pairs • Signal = input from electrodes • Action state = “performing action” or “not” • Possible features = amplitude of {electrode1, electrode2, …} x {freq1, freq2, …} • Rank features using autoregressive model • Choose top K • Weights from autoregressive model (?)
Experiment • Offline training to learn features, weights • Online development testing • Online feature, weight adjustment • Final round of testing
Interesting Observation • Offline (no feedback) looks different than online (with feedback)
Conclusions • Users can control a 1d cursor with ECoG • Closed loop looks different than “open loop” • Experimenting with epilepsy patients is hard