Download
1 / 55
550 likes | 685 Views
The East Asian Dollar Standard and China’s Exchange Rate. Ronald McKinnon Stanford University April, 2005. The Exchange Rate Debate in the 1990s. Before 1997, East Asian countries, except for Japan, “ softly ” pegged their exchange rates to the U.S. dollar.

E N D
The East Asian Dollar Standard and China’s Exchange Rate Ronald McKinnon Stanford University April, 2005
The Exchange Rate Debate in the 1990s Before 1997, East Asian countries, except for Japan, “softly” pegged their exchange rates to the U.S. dollar. 1997-98 Crisis: Thailand, Indonesia, Philippines, Korea, and Malaysia are attacked and devalue—with bankruptcies and economic downturns spreading contagiously. The IMF blames the soft pegging for encouraging over borrowing and current account deficits leading unsustainable dollar and yen debts. It warns against any return to dollar pegging. Williamson (2000), Kawai (2002), Ogawa and Ito (2002)—suggest weighting the Japanese yen more heavily in the currency baskets of the smaller East Asian economies in the face of wide fluctuations in the yen/dollar rate.
The Debate In the New Millennium • By 2003 into 2005, the East Asian “crisis” and non crisis economies had returned to soft dollar pegging. China and Hong Kong retained hard pegs through the crisis, and Malaysia pegged in Sept 1998 at 3.8 ringgit per dollar. Even the yen/dollar rate is more stable. • But now all East Asian countries run large current account surpluses—even with net inflows of FDI (China). In 2003 and 2004, only massive official interventions kept their exchange rates from appreciating. • Intensified pressure from the IMF, the G-7, and the U.S. Treasury, for China to appreciate: “There should be more flexible currencies, not only for China but the whole of Asia” Rodrigo de Rato, IMF Managing Director, 29 Sept 2004 at IMF-World Bank Meetings in Washington.
Table 3: East Asian Current Accounts in Comparison to the U.S., 1990-2003 Data source: IMF: IFS. *Preliminary from EIU data
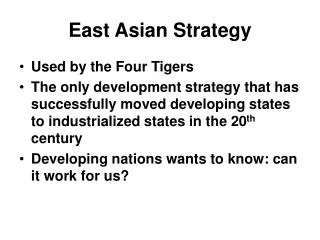
This Paper and McKinnon Book (2005) The Case for Asian Dollar Pegs • East Asian economies • Have sufficient fiscal and monetary control to target exchange rates, but have more difficulty targeting domestic inflation independently. • Are becoming highly integrated economically with more than 50% of trade with each other. They need stable cross rates of exchange. • Under developed domestic bond and forward exchange markets make currency risks more difficult to hedge. • Current account surpluses need not diminish if currencies appreciate, as is likely under floating
The Rise of Intra Regional Trade in East Asia, 1980-2002 (share of total exports) East Asia: China, Hong Kong, Indonesia, Japan, Korea, Malaysia, Philippines, Singapore, Taiwan, and Thailand
The Rise of Intra Regional Trade in East Asia, 1980-2002 (share of total imports) East Asia: China, Hong Kong, Indonesia, Japan, Korea, Malaysia, Philippines, Singapore, Taiwan, and Thailand
Invoice Currencies in Korean Trade, 1980—2002 (percent) Source: Bank of Korea: Monthly Statistical Bulletin. Trade in services is not included. DM represents the euro starting from 2000.
Chinese Yuan Hong Kong Dollar Singapore Dollar Taiwan Dollar Figure 1: East Asian Exchange Rate Pegs against the Dollar, 1980:01-2004:04 (Monthly)
Indonesian Rupiah Korean Won Malaysian Ringgit Philippine Peso Thai Baht Figure 1 (Continued) Crisis Economies, 1980:01-2004:04 (Monthly)
Frankel and Wei Regression (1994) • Problem: For any one East Asian currency other than Japan, how do you measure the weight of each major currency—the dollar, yen, or euro—in its currency “basket”? • Answer: Choose an outside currency as numeraire, e.g., the Swiss Franc, to measure all exchange rates in the above regression.
Chinese Yuan Hong Kong Dollar Singapore Dollar Taiwan Dollar Figure 2: Dollar’s Weight in East Asian Currency Baskets, 130-Trading-Day Rolling Regressions, 1990:01-2004:05(Daily)
Indonesian Rupiah Korean Won Malaysian Ringgit Philippine Peso Thai Baht Figure 2: Dollar’s Weight in East Asian Currency Baskets, 130-Trading-Day Rolling Regressions, 1990:01-2004:05(Daily)
Table 1: Standard Deviations of Daily Exchange Rate Fluctuations against the Dollar Data source: Datastream. Percent changes. Pre-crisis = 02/01/94 – 05/30/97, crisis = 06/01/97 – 12/31/98, post-crisis = 01/01/99 – 05/17/04, 2003/2004 = 01/01/03 – 05/17/04.
Dollar dominance in East Asia • Original sin • Underdeveloped domestic bond market or in some cases developed domestic bond market (India) • Debtors cannotborrowin own currency nor can they hedge their net dollar indebtedness. • Currency mismatch and maturity mismatch. [Eichengreen and Hausmann 1999, Hausmann and Panizza 2003] • Conflicted virtue • Creditors cannot lend in their own currencies nor can they hedge their net dollar assets. • Currency mismatch but no necessary maturitymismatch [McKinnon and Schnabl 2004, McKinnon 2005]
Fun with Translation名词翻译 • Conflicted virtue High-saving dilemma: 高储蓄两难 • Original sin: 原罪 (Christian) Sin from the past life: 前世之罪 (Buddhist)
High-saving countries run current account surpluses but lend in dollars. However, as their stocks of dollar claims cumulate: Foreigners start complaining that the country’s ongoing flow of trade surpluses is unfair and the result of having an undervalued currency. Domestic private holders of dollar assets worry more about a self-sustaining run into the domestic currency forcing an appreciation. Domestic interest rates are bid down, perhaps to zero Conflicted virtue
Conflicted virtue: To appreciate or not to appreciate • As runs into the domestic currency out of dollars begin, the government is “conflicted” because (repetitive) appreciation could set in train serious deflation ending with a zero interest liquidity trap (Japan) • But failure to appreciate could elicit trade sanctions from foreigners. • A “free” float becomes an indefinite upward spiral
The story of Japan (I) • There were repetitive appreciations of yen from 1970s to mid-’90s under mercantile pressure from trade partners―particularly the United States. But trade surpluses continued to cumulate. • Reason: Exchange rate changes only determine domestic inflation or deflation, not trade balance. The simple-minded elasticities approach (Marshall-Lerner condition) to determining the trade balance is invalid in financially open economies. [McKinnon and Ohno 1997]
The story of Japan (II) • Negative risk premium[Goyal and McKinnon 2003] • To maintain portfolio balance, Japanese financial institutions demand a higher return on dollars (which is riskier given the volatility in exchange rate). • But the interest rate on dollar assets is determined internationally. • Thus the interest rate on yen assets was forced down — leading to a zero interest liquidity trap by the end of 1996.
Is China like Japan? • China has a big advantage over Japan: The RMB exchange rate has been, and can be, more credibly maintained at the current level without disturbing domestic price level. • And a disadvantage: China’s net FDI inflows are much larger than Japan’s. FDI can be seen as illiquid liabilities but adds to liquid dollar claims.
Figure 7: International Investment Position of Japan (Billions of Dollars) Source: Japan: Ministry of Finance.
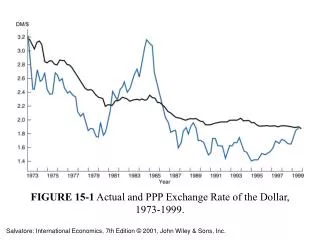
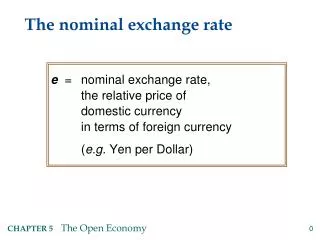
The Yen-Dollar Nominal Exchange Rate, 1970 - 2005 Source: International Financial Statistics, IMF
Implications for Interest Rates: The Negative Risk Premium • To sustain the interest differential between yen and dollar assets, consider an augmented interest parity relationship: • From the 70s to the mid 90s, the interest differential, i – i*, was driven primarily by the negative term from the erratically appreciating yen, which peaked in April 1995. • Since the mid-90s, 0 and the interest differential has been driven primarily by the term, which is also negative (Goyal and McKinnon 2003, McKinnon 2005).
Figure 8: Interest Rates in the US and Japan, Long-Term: 10-Year US Treasuries and JGBs, 1980-2004
Figure 8: Interest Rates in the US and Japan, Short-Term: Money Market Rates, 1980-2004
Interest Differentials, Portfolio Balance, and the Impossibility Free Floating • As dollar claims accumulate, a sufficiently large interest differential to induce private portfolio holdings of dollars becomes unsustainable—as in Japan when yen interest rates approach zero. • The problem worsens when US interest rates are unusually low, as in 2003 and 2004. • Then, increasing official foreign exchange reserves become the dominant mode of financing Asian current account surpluses. • And the private unwillingness to hold dollars makes a free float impossible.
Table 4: East Asian Current Accounts (CA) and Changes in Foreign Reserves (RC): 1997 - 2003 Data source: IMF: IFS. *Preliminary from EIU data
Figure 10: US and cumulative East Asian Current Accounts (Billions of US Dollars) Data source: IMF: IFS.
The Dollar Standard and East Asia’s Trade Surplus: The DFG Interpretation* • “Revived Bretton Woods” • EA Exchange Rates deliberately undervalued to generate a trade surplus. • Exports are desired to promote “development”, particularly in manufacturing. • Asian governments are willing to invest in very low yield US Treasuries, and to accept American FDI with high profit repatriation. • US gets finance for its fiscal deficits • The ongoing US current-account deficit need not be corrected in the near future * Dooley, Folkerts-Landau, and Garber (2003)-(2004).
The Dollar Standard and East Asia’s Trade Surplus: The MCK Interpretation, I • The current regime: • With the dollar as international money, the efficiency of world trade and payments increases. • With a stable U.S. price level, peripheral countries will peg to the dollar to anchor their own price levels—particularly East Asian countries highly integrated in trade. • They converge to relative purchasing power parity (PPP) if nominal exchange rates remain fixed: no exchange rate “undervaluation”
The Dollar Standard and East Asia’s Trade Surplus: The MCK Interpretation, II • Proposed East Asian exchange rate changes: discrete appreciation or floating • No predictable effect on net trade balances • Any appreciation will slow economic growth and lead to deflation • Loss of credibility to maintain the exchange rate at any level • Possibility of an indefinite upward spiral in the dollar value of East Asian currencies
The Dollar Standard and the United States: MCK Interpretation • The unlimited US credit line with the rest of the world softens borrowing constraints on US households, and the federal government. • Federal fiscal deficits are financed by selling dollar bonds to foreigners at low interest rates. • Large current account deficits are sustainable “indefinitely” because of the central international monetary position of the United States. • The upshot of easy foreign borrowing is: – falling US saving, both government andprivate, for more than 20 years. – deindustrialization, loss of jobs in manufacturing, leading to protectionist pressure.
US Current Account and Manufacturing Sector Trade Balance: 1965 - 2004 (Percentage of GDP)
Projection of Labor Growth in Manufacturing under Balanced Manufacturing Trade: 1965 - 2004 (Share of US Labor Force)
American Fiscal and Trade Deficits • The Fed creates the definitive international money. An attack on the dollar is unlikely because US debts are denominated in its own currency. • But heavy US foreign borrowing is transferred in real terms through large American trade deficits, mainly in manufactures. • The American concern with de-industrialization, i.e.,unduly rapid job losses in manufacturing, should be linked to Federal fiscal deficits and low American personal saving.
The Exchange Rate and International Adjustment • Two Contradictory Views • A flexible exchange rate is useful for adjusting the net trade balance to net international capital flows • A fixed exchange rate can anchor the domestic price level by inducing money wage growth that balances differential productivity growth across countries • This paper pursues 2. on the presumption that 1. is false and misleading for open economies McKinnon and Ohno (1997) Chs 6 and 7
Balancing International Competitiveness:The Scandinavian Model (SM) • Wage adjustment and relative Purchasing Power Parity (PPP) under a fixed exchange rate • Sweden, 1948 to 1971 5.17 kronor per dollar • Japan, 1949 to 1971 360 yen per dollar • China, 1994 to 2005 8.28 yuan per dollar
Scandinavian Model Assumptions: • Inflation in tradables sector converges to world inflation plus any exchange rate depreciation (relative PPP) • Wage bargaining is initiated in the high-productivity-growth tradables sector (manufactures) subject to the exchange rate constraint • Labor “solidarity”: wage growth in other sectors with lower productivity growth follows that in tradables Result: • International competitiveness between fast- and slow- growing economies is automatically balanced by differential growth in wages.
Relative PPP Wage bargaining in tradables: constant factor shares Labor solidarity Nontradables price based on labor cost General price index ( CPI) with constant weights Higher productivity growth in tradables SM Assumptions
SM: General Supply-Side Inflation • No independent demand-side national monetary policy • Tradable price increases are transmitted directly into domestic inflation through the foreign exchanges • Additional general price inflation is proportional to the difference in productivity growth between the two sectors weighted by the importance of nontradables • Even when exchange rates are fixed, inflation can differ across countries with different productivity growth. Imported Inflation Exchange Rate Induced Inflation Structural Inflation
China, Convergence of CPI Inflation with the United States: Relative PPP (Source: EIU)
Determinant SM Wage Bargaining with a Fixed Dollar Exchange Rate • Dollar is the key currency: most trade is invoiced in dollars with “pricing to market” • U.S. price level is stable with relative PPP • Wage bargaining • Bidding for workers in tradables constrained by the fixed exchange rate. • Money wage growth reflects ongoing productivity change in the tradables sector • Wages then grow similarly in other sectors • Compare Japan 1949 -1971 to China 1994 - 2005
Table 1: Key economic indicators for Japan and the U.S. under a fixed yen/dollar exchange rate, 1950-1971 (average annual percent change) a 1952-1971. b 1953-1971. c 1951-1971.
Figure 1: Nominal Manufacturing Wage Growth for US and Japan: 1950–1971
Figure 2: Inflation and Wage Differentials between Japan and US, and Yen/Dollar Rate
Indeterminant Wage Bargaining in the SM with a Floating Exchange Rate • When the exchange rate fluctuates: • Relative PPP will not hold continuously • Exchange rate no longer anchors the domestic price level to world inflation. • Need for an independent national (demand-side) monetary policy. • Money wage bargaining over productivity gains now is in limbo. Bargainers cannot judge the course of domestic inflation relative to movements in the exchange rate. • The tradables sector need no longer be the leading sector for wage determination.
Table 2: Key economic indicators for China and the U.S. under a fixed yuan/dollar exchange rate, 1994-2003 (average annual rates of change) a Ex-factory price index. b 2003 data on manufacturing wages is projected from overall average wages from 1997-2003. c 1994-2002. d 1994-2001. Zhang and Tan e 1994-2002. R. Fernholz
Figure 3: Nominal Manufacturing Wage Growth for US and China: 1994 – 2003