Download
1 / 23
230 likes | 315 Views
Lecture 2 Regression relationships. 2.1 The influence of actual widths of the anorexics 2.2 Testing the importance of each influence 2.3 Comments on the anorexia study. 2.1 The influence of actual widths of the anorexics. Scatter plot. Observations BPI decreases with actual width

E N D
Lecture 2Regression relationships 2.1 The influence of actual widths of the anorexics 2.2 Testing the importance of each influence 2.3 Comments on the anorexia study Statistical Methods in Scientific Research - Lecture 2
2.1 The influence of actual widths of the anorexics Statistical Methods in Scientific Research - Lecture 2
Scatter plot Statistical Methods in Scientific Research - Lecture 2
Observations BPI decreases with actual width The controls have smaller waists than the anorexics! Actual width appears to be a stronger determinant of BPI than anorexic status Statistical Methods in Scientific Research - Lecture 2
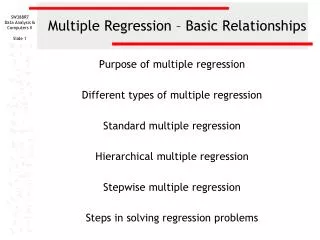
Five models for the data 1 INTERCEPT Neither anorexia nor actual width affect BPI 2 INTERCEPT + GROUP Anorexia affects BPI, but actual width does not Statistical Methods in Scientific Research - Lecture 2
3 INTERCEPT + AW Actual width affects BPI, but anorexia does not 4 INTERCEPT + GROUP + AW Anorexia and actual width affect BPI additively Statistical Methods in Scientific Research - Lecture 2
5 INTERCEPT + GROUP + AW + INTERACTION Anorexia and actual width affect BPI non-additively Which model fits the data best? How can we judge? How should we play off goodness-of-fit against complexity? Statistical Methods in Scientific Research - Lecture 2
Residuals The residuals are the vertical distances between the observed points and the fitted models: residual = BPIobserved – BPIfitted For example, for Model 4 we have: Statistical Methods in Scientific Research - Lecture 2
Showing only the residuals, we have: Statistical Methods in Scientific Research - Lecture 2
Moving them all down to 0 gives: The goodness-of-fit of a models is assessed in terms of the residual sum of squares, RSS, (the smaller, the better): Statistical Methods in Scientific Research - Lecture 2
Model fits degrees-of-freedom (df) = n - # parameters Goodness-of-fit improves as terms are added into the model, although model complexity (number of parameters) increases (which is a bad thing) Statistical Methods in Scientific Research - Lecture 2
2.2 Testing the importance of each influence Interaction We start with the most complex model (Model 5), and see whether it can be simplified That is, we test H0: there is no aw group interaction (Model 4 is valid) If the observations are normally distributed, then if Model 4 is true, then Fint follows an F-distribution with (1, 15) degrees-of-freedom: that is Fint ~ F1,15, where Statistical Methods in Scientific Research - Lecture 2
Interaction Large values of Fint indicate that H0 is false Here, we have This value is too small to suggest that interaction is important The p-value is p = P(F 0.38) where F ~ F1,15, and p = 0.5459 Statistical Methods in Scientific Research - Lecture 2
Actual width Take the model in which BPI depends on actual width only (Model 3), and see whether the effect of actual width is necessary That is, we test H0: actual width does not effect BPI, which means that Model 1 is valid If the observations are normally distributed, then if Model 1 is true, then Faw ~ F1,17, where Statistical Methods in Scientific Research - Lecture 2
Actual width We have This value is too large to come from the F1,17 distribution The p-value is p = P(F 28.26) where F ~ F1,17, and p < 0.0001 H0: actual width does not effect BPI is rejected Statistical Methods in Scientific Research - Lecture 2
Group Accepting that actual width is needed in the model, now take Model 4, and see whether it can be simplified by removing the effect of anorexia That is, we test H0: anorexia does not effect BPI (once aw is allowed for), which means that Model 3 is valid If the observations are normally distributed, then if Model 3 is true, then Fgroupaw ~ F1,16, where Statistical Methods in Scientific Research - Lecture 2
Group We have This value is too small to suggest that group is important The p-value is p = P(F 0.74) where F ~ F1,16, and p = 0.4030 Statistical Methods in Scientific Research - Lecture 2
Final model This is Model 3, which states that BPI has mean = -8.47 + 338.5 aw standard deviation = 395.74 = 19.89 and that being anorexic has no significant effect on body perception index Statistical Methods in Scientific Research - Lecture 2
Order of fitting is important Test interaction first: if this is significant, then the two main effects should not be tested: Model 5 is needed to describe the data Then determine whether actual width is needed in the model - As actual width is needed, test the effect of group (the factor that is of interest), by comparing Model 3 with Model 4 - If actual width were not needed, test the effect of group by comparing Model 1 with Model 2 Statistical Methods in Scientific Research - Lecture 2
Order of fitting is important To compare Model 1 with Model 2, find which is The p-value is p = P(F 2.63) where F ~ F1,16, and p = 0.1232 Statistical Methods in Scientific Research - Lecture 2
Order of fitting is important The t-statistic for testing the effect of anorexia shown on Slide 1.11 was equal to -1.622 The square of -1.622 is 2.631, which is equal to Fgroup This is no coincidence: these two tests are in fact identical BUT, in this case, due to the important influence of actual width, any analysis that fails to account for aw is invalid Statistical Methods in Scientific Research - Lecture 2
2.3 Comments on the anorexia study Choice of subjects The anorexics were consecutive unmarried female patients at St George’s Hospital, London The controls were volunteer fifth form pupils from Putney Girls’ High School, with normal dietary habits Ages: Anorexics mean = 19.7, sd = 3.6 Controls mean = 15.4, sd = 0.5 This was not a suitable control group for this study Statistical Methods in Scientific Research - Lecture 2