Download
1 / 18
180 likes | 450 Views
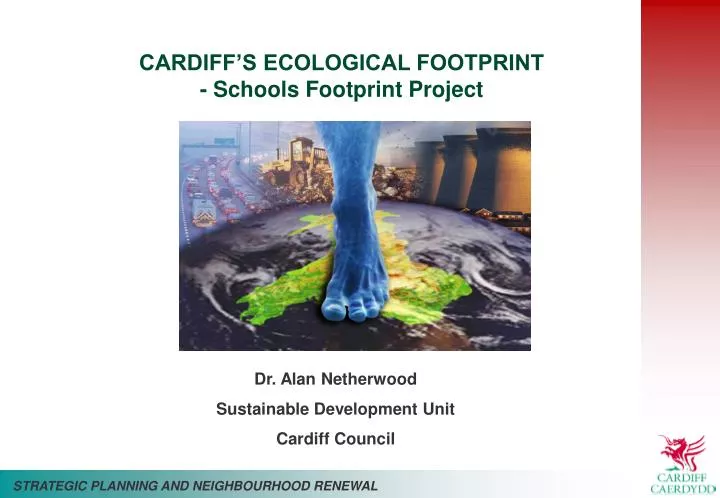
CARDIFF’S ECOLOGICAL FOOTPRINT - Schools Footprint Project. Dr. Alan Netherwood Sustainable Development Unit Cardiff Council. ECOLOGICAL FOOTPRINTING – A SIMPLE GUIDE. The footprint measures human demand for resources against nature’s available supply.

E N D
CARDIFF’S ECOLOGICAL FOOTPRINT - Schools Footprint Project Dr. Alan Netherwood Sustainable Development Unit Cardiff Council
ECOLOGICAL FOOTPRINTING – A SIMPLE GUIDE • The footprint measures human demand for resources against nature’s available supply. • How much nature have we got compared to how much we use? • If everyone lived western lifestyles we would need nearly three planets worth of resources to survive. • Our fair ‘earthshare’ is 2.18 global hectares (gha) • A United States citizen has a ‘footprint’ of 9.6 gha • A citizen of India has a ‘footprint ’of 1 gha • A citizen of Wales has a footprint of 5.25 gha (based on proxy data) • What is Cardiff’s global footprint per capita and what are the most significant areas of resource use? • Are our levels of resource consumption sustainable? • How can this information be used to inform policy and raise awareness of sustainable lifestyles?
18 month project to measure the Ecological Footprint of Wales, Cardiff and Gwynedd. Complete September 2004. Partnership includes: Welsh Assembly Government, Cardiff Council, Gwynedd Council, Cardiff University, Stockholm Environment Institute, Bangor University, WWF,CCW, Environment Agency, Welsh Development Agency. £330,000 from BiffAward with 10% matched funding from Councils and Welsh Assembly Government. (£5000 from Cardiff) Stockholm Environment Institute to undertake materials flow analysis and measure footprint, Universities to gather data and develop sustainable scenarios with Council policy officers. This project is cutting edge, no city has used footprinting like this and worked so closely with policy officers in the Council – on policy outputs rather than as an academic exercise. THE PROJECT PARTNERSHIP
REMINDER - WHY WE ARE DOING THIS • a policy commitment in the Local Sustainability Strategy for Cardiff to measure the City’s ecological footprint.(Section 7) • included as a quality of life indicator in the Community Strategy for Cardiff. • it is the best available tool to measure the city’s impacts on the global environment • provides a resonant tool and metaphor to promote awareness of sustainable consumption and production and sustainable lifestyles. • new data on materials flows and the city’s impacts will provide a clearer picture to the Council on the scale of the problems the city faces. • provides evidence to inform debate and policy within the Council • put Cardiff’s impacts in a global context for politicians, officers and the general public. • footprint aligns the Council with regional government thinking on sustainable development. • Innovation -Cardiff Council (along with Gwynedd Council) will be the first Welsh local authorities to use this tool.
WHAT DO FOOTPRINTS TELL US? • A Londoner per annum uses • 13MWh of electricity (only 1% is sourced from renewables) • Produces 0.5 tonne of household waste (only 10% recycled) • Travels 8400 km (66% by car) • Eats 680 kg of food (81% imported from outside the UK) • 28% of London’s water (876 million litres) is lost through leakage For London to be sustainable by 2050 each citizen would need to: • Reduce gas consumption from 9.5 MWh to 6.2 MWh • Install 11m2 of solar panels • Travel 3000km less every year • Consume 70% less meat • Reduce food waste by 100kg • Produce 1 tonne less waste • Eat 40% seasonal, locally produced food • York - 33% of food purchased goes directly to landfill
EXAMPLES OF POLICY OPTIONS FOR CARDIFF • What would be the ecological affect of a congestion charge? • How can we reduce the ecological impact of food? • How do we manage waste in Cardiff in the most ecologically friendly way? e.g. increased recycling and composting • How would the introduction of organic milk into schools affect the ecological footprint? • How can we decrease the transport footprint by decreasing car travel and increasing other modes (rail, walking, bus, cycling) • How can we increase proportions of renewable energy used and what effect would this have? • How can we manage events more sustainably? • The footprint study is also being used experimentally on events, housing, Sports Village and schools.
INITIAL FOOTPRINT RESULTS Ecological Footprint of Cardiff: Food 30.1% Infrastructure 18.5% Energy 16.3% Waste 15.6% Transport 13.6% Households 5.8% Water 0.08% These results hide more specific patterns: Food eaten in the home Commercial infrastructure Passenger transport Municipal waste Domestic energy
There are two main aims to the project, one short term the other long. The main short term aim is to collect data that can be fed into the main Ecological Footprint project and act as a experimental stage to discern where data gaps lie and how they are best filled. The main long term aim is to develop an educational and policy tool for schools that facilitates the delivery of curriculum subjects and PSE in a ‘real world’ way, assists with Eco-school status and provides a framework that can be used and applied in school management and self evaluation. AIMS OF THE SCHOOL FOOTPRINT PROJECT
In the financial year 2004 / 2005 £150 million was delegated to the 138 schools in Cardiff. This includes a large procurement budget that can assist with sustainable development principles. If Cardiff Council were to replace conventional whole milk with organic in their school meals menu this would reduce the ‘milk footprint’ per pupil by 29.3%. EF is an excellent tool for teaching a wide range of subjects and represents a tangible project. INFLUENCE OF THE SCHOOL FOOTPRINT PROJECT
There is an issue here as the University has deadlines to keep. It is suggested that the following are key dates for action: By end of November 2004 there needs to be an analysis of data to identify where data exists and where there are gaps. By end of autumn term there needs to be some work done to standardise any surveys required to fill these data gaps. By end of winter half term any surveys carried out need to be completed. By the end of the winter term initial results and feedback need to be with the schools SHORT TERM TIMESCALE
LONG TERM TIMESCALE • To review progress and effectiveness of data collection methods by end of summer term • To develop data collection methods to increase accuracy and sophistication of the EF tool over time. • Participating schools to run an annual EF on the school to review progress and to engage pupils in data collection that is directly relevant to the school • To develop curricular areas where EF work can be incorporated into mainstream teaching.
WORKING IN PARTNERSHIP In order to identify data gaps the SDU has already been in contact with a number of departments and found a variety of data sources. These include: • Land use • Energy • Waste Schools are best placed to individually look at: • Past surveys and other school based data sources • Consumables and durables Pupils are best placed to source primary data on: • Transport • Food
DATA THAT THE UNIVERSITY REQUIRES - an example
Work is required to change the nature of the data that is collected, since the University’s data requirements are very different from any raw data that can be collected by schools. It should be noted whether the data is factual, best guess etc. also ALL data should have where, when, how, who etc of where the info came from and any assumptions made in extrapolations etc. As long as we can justify the data then we can make allowances for this in the calculations, eg. If the data is not from 2001. WHAT ABOUT DATA THAT WE CANNOT FIND OR THAT DOESN’T FIT EXACTLY WITH THE PROFORMA?
The results and the associated scenarios will be presented back to the schools. It will be useful as it will help identify curriculum links. It will be an informative tool for using in school management issues. It will help inform policy for the schools service. It will feed into the wider application of foot printing into Cardiff schools. Cardiff University will use the results in an academic publication. It may have a wider link to a larger educational project that WWF Scotland are undertaking. SCHOOL FOOTPRINT PROJECT – OUTPUTS