Download
1 / 44
490 likes | 762 Views
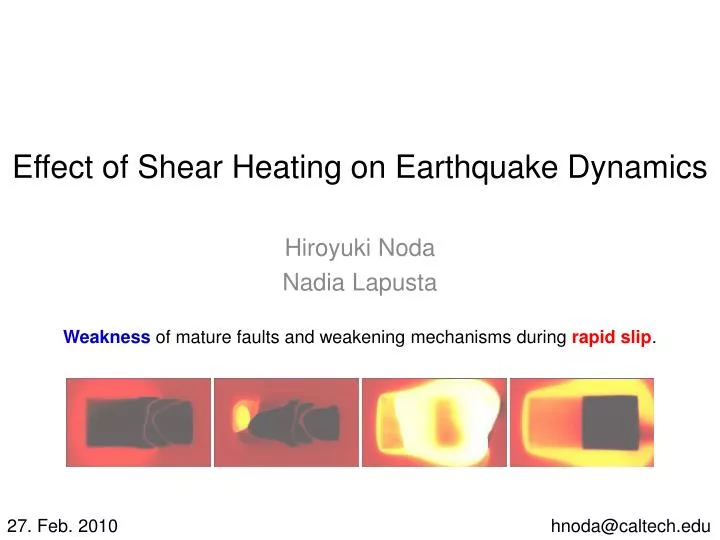
Effect of Shear Heating on Earthquake Dynamics. Hiroyuki Noda Nadia Lapusta. Weakness of mature faults and weakening mechanisms during rapid slip. 27. Feb. 2010. hnoda@caltech.edu. Outline. Observational facts on fault stress. Experimental results on rock friction.

E N D
Effect of Shear Heating on Earthquake Dynamics Hiroyuki Noda Nadia Lapusta Weakness of mature faults and weakening mechanisms during rapid slip. 27. Feb. 2010 hnoda@caltech.edu
Outline • Observational facts on fault stress. • Experimental results on rock friction. • Thermal weakening mechanisms: - strong rate-weakening due to flash heating - thermally induced pore pressure build-up • Earthquake sequence simulations - allowing temperature and pore-pressure change.
Are major well-developed faults strong or weak? Definition based on average shear stress level Statically, we expect t = 200 MPa × 0.6 ~ 100 MPa at typical seismogenic depths. Well-established fact: Average static stress drop is 1 to 10 MPa (Typical average stress change in a large earthquake)
Observational evidence for “weak” major faults The outflow of heat observed for the San Andreas fault implies that shear stresses acting during sliding are of the order of 10 MPa or less (Brune et al., 1969; Henyey and Wassenburg, 1971; Lachenbruch and Sass, 1973, 1980). Steep angle between the principal stress direction and the fault trace inferred for some major strike-slip faults (e.g., Townend and Zoback, 2004; Hickman and Zoback, 2005) Significant rotations of principal stress directions (e.g., Wesson and Boyd, 2007). Geometry of thrust-belt wedges (Suppe, 2007).
Why would faults be “weak” on average? Fault is CLOSE to static failure before large events, small dynamic stress variations, nucleation can occur anywhere Fault is FAR from static failure before large events, large dynamic stress variations, nucleation in special places
Friction experiments for rocks Plate motion ~ 1 cm/yr Earthquake “Byerlee’s law” [1978] Weakening Figure from Wibberley et al., 2008 Many physical processes are proposed to explain this weakening at high slip rates, but frictional heating and temperature rise play an important role in most of them.
Goal: To produce a model of earthquake sequences consistent with observations and realistic rock-friction properties. Long-term stress accumulation process and rapid dynamic ruptures Prior studies: Sequences without weakening (Lapusta and Liu, 2009) Individual events with weakening (Noda et al., 2009)
Flash heating of microscopic contacts First introduced in a field of dry metal friction Bowden and Thomas, 1954; Archard, 1958/1959; Ettles, 1986; Lim and Ashby, 1987; Lim et al., 1989; Molinari et al., 1999 Very high stress (~yield stress) and high slip rate. Extremely high temperature at the contact. (~ melting point) Weakening above about 0.1 m/s,τ(V) ~ 1/V + const. [Rice, 1999]
Hydrothermal effects on frictional resistance Effective stress law Elastodynamic normal stress (positive in compression) Since the thermal expansivity of water is much larger than that of rocks, frictional heating can increase p if the surrounding medium is not very permeable. Pore pressure Effective normal stress Shear traction Friction coefficient Thermal pressurization Frictional heating, temperature rise Thermal expansion of pore fluids Increase in pore pressure (depends on rock permeability) Decrease in frictional resistance - First introduced in considering catastrophic landslides (Hibab, 1967) - Many application to earthquakes (Sibson, 1973; Lachenbruch, 1980; Mase & Smith, 1985, 1987; Segall & Rice, 1995; Andrews, 2002; Garagash & Rudnicki, 2003; Rice, 2006; Noda, Dunham, & Rice, 2009; among many others).
3D calculation allowing changes in temperature and pore pressure In collaboration with N. Lapusta (Caltech) Inertial effects are included. 30 MPa initial effective normal stress. Two patches (15 km x 15 km) Patch I at negative x Rate-weakening friction High hydraulic diffusivity Patch II at positive x Rate-weakening friction Potentially low hydraulic diffusivity (susceptible to thermal pressurization)
Complexity in earthquake magnitude distribution Magnitude of the events as a function of time Without heterogeneity, the model produces characteristic events. Heterogeneity causes long earthquake cycles that contain events of different sizes.
Interseismic shear stress Mid-depth shear stress distribution Interseismic stress distribution is controlled by that of frictional resistance at coseismically high slip rate.
Motivation: 1999 (Mw 7.6) Chi-Chi, Taiwan, earthquake • Lab-measurements of bore hole samples have revealed notable difference in hydraulic diffusivities between North and South though they are shallow depth (~ 1 km) [Tanikawa and Shimamoto, 2009]. Figure from Ma et al. [2001] • Temperature measurements at bore holes in the North showed that the frictional resistance is only ~ 0.1×snduring the earthquake [Tanaka et al., 2006; Kano et al., 2006]. • The long-period component is dominant in the northern region where the fault slip is larger than the southern region [e.g. Ma et al., 2003]. Figure from Ma et al. [2003] We reproduced those features in our earthquake sequence calculation.
Conclusions • We have developed a methodology for simulating earthquake cycles that accounts for the evolution of temperature, frictional resistance and pore pressure. • Our models explain many observational facts about earthquakes on mature faults. • Proper inclusion of high-velocity friction is very important in models of earthquake cycles, as it determines the long-term shear stress on a fault, making the fault appear weak.
2D earthquake sequence simulation with thermal weakening mechanisms In collaboration with N. Lapusta (Caltech) and J. R. Rice (Harvard) Crustal-plane model [Lehner et al., 1981; Kaneko and Lapusta, 2008]. Inertial effects are included “Flash heating” embedded in the friction law. Temperature and pore pressure diffusion of the fault plane. A weak patch at the end to nucleate ruptures frequently.
Long-term shear stresses red Long-term heat production rates • Thermal weakening mechanisms tremendously decrease the averaged shear stress on the fault and long-term heat production rate.
Stress history during an event A case with flash heating • Ruptures can propagate at a very low pre-stress producing a reasonable value of stress-drop although the peak shear stress is high.
Sequence of pulse-like ruptures A case with flash heating } 100-150 yr every 2 seconds • We produced a sequence of pulse-like ruptures.
Nucleation locations on faults with heterogeneous hydraulic diffusivities • - Theoretical estimate of the nucleation length is smaller if TP is more efficient [Segall and Rice, 2006]. • However, our simulations show that such areas may actually be unfavorable for earthquake nucleation due to interseismically lower shear stress. Nucleation is here Steady state sliding is less stable here. This point highlights the importance of considering the effects of variation in the physical properties in the context of earthquake sequences. Revision needed.
Aim of this work • To develop a methodology for long-term, earthquake sequence simulations fully accounting for the inertial and hydrothermal effects. • To see how the frictional and hydraulic properties affect earthquake cycles: stress state, spatio-temporal slip distribution, and characteristics of each dynamic event. • To see if it is possible to produce differences in frequency content of seismic radiation from different parts of the fault, as observed in the 1999 Chi-Chi, Taiwan, earthquake. Details skipped I’ll concentrate on “strength of a fault” today. Details skipped
Combined effect of rate-hardening and T.P. Less negative a-b in a patch at x > 0
Frequency contrast in the coseismic fault motion Large slip, but depleted in high frequencies
Friction law on the fault (y = 0, x and z vary) Friction law with effective normal stress f θ σn p V : Friction coefficient : State variable (slowness) : Total normal stress on the fault : Fluid pressure : |V| Rate- and state-dependent friction coefficient a b V0 f0 : Parameter representing direct effect : Parameter representing evolution effect : Reference slip rate : Reference friction coefficient State evolution law (aging law or slowness law) L θss : Characteristic evolution length (slip) : State variable at the stead state
Temperature and fluid pressure evolution Diffusion of temperature normal to the fault T αth ω ρ c : Temperature : Thermal diffusivity : Heat generation per unit volume : Density : Heat capacity per unit mass Diffusion of fluid pressure normal to the fault αhy Λ : Hydraulic diffusivity : Fluid pressure change / temperature change Heat source distribution w : Half width of the shear zone
Patch I Patch II
Slip rate distribution at z = 0, every 1 sec The maximum slip velocity does not change much. The “tail” becomes longer as thermal pressurization becomes effective.
Problem setting Revise to smaller table Two patches (15 km x 15 km) with gradual margins. Starting from b-a = 0.004 and αhy = 10-2 m2/s in both patches, they are decreases in the patch at x > 0.
Lab-measured physical propertiesrate- and state- parameters Samples are collected from bore holes in the northern and southern regions from a fault zone which ruptured 1999 at 200 – 300 m depth. North: Rate-hardening South: Rate-weakening Tanikawa and Shimamoto, 2009
Stress-reduction curves and low heat generation Shear stress as a function of slip at x = -10 km (black) and 10 km (gray). Apparent stress weakening distance is determined by rate- and state-law in the permeable region, and by T.P. in the less permeable region.
Lab-measured physical propertiespermeability North: Less permeable South: More permeable Tanikawa and Shimamoto, 2009
Summary of measured physical properties [Tanikawa and Shimamoto, 2009] South : Rate-weakening Susceptible to nucleation More permeable North : Rate-hardening Less permeable Susceptible to thermal pressurization This data serves as motivation for exploring heterogeneities in rate dependence and permeability (hydraulic diffusivity) along the faults. We caution that the data is based on only two points at shallow depths (~ 200-300 m).
Low shear stresses on a mature fault Townend and Zoback, 2004 Orientation of horizontal maximum compressional stress is at a very high angle (~ 70o) from San Andreas Fault (SAF). Shear stress sustained by a fault is very low (at most 0.3 of normal stress).
“Heat flow paradox”, no detectable heat flow anomaly Measured heat flow around SAF Mean Expected heat flow anomaly based on a conventional frictional properties. Lachenbruch and Sass, 1980 On a long-term average, heat generation rate is very small.
Low stress drop during earthquakes 1 MPa 10 MPa Kanamori and Anderson, 1975 Stress drop (change in shear stress before and after an earthquake) is typically several MPa, despite the normal stress is ~ 100 MPa.
The observational facts suggests ... • At initiation of an earthquake, the average shear stress is very low compared to the normal stress (~ 100 MPa). • Most of the slip and frictional heating is produced at even lower shear stress. • When a rapid slip event is terminated, the average shear stress is only modestly lower than the initial value. Goal: To produce such sequence of earthquakes numerically, consistently with realistic rock-frictional properties. Long-term stress accumulation process and rapid dynamic ruptures
Backbone of the constitutive fault response in our model: Rate and state friction Laboratory-derived(Dieterich, 1979, 1981; Ruina, 1980, 1983; ...) for slip velocities small ( ~ 10-9 – 10-3 m/s) compared to the seismic range. Unique tool for simulating earthquake cyclesin their entirety, from accelerating slip in slowly expanding nucleation zones to rapid dynamic propagation of earthquake rupture to post-seismic slip and interseismic creep to fault restrengthening between seismic events. Base friction f0 = 0.6 at V0 = 1 m/s Variations a = 0.015, b = 0.019, L = 1-100 μm (lab values), a – b > 0, velocity strengthening: Slow sliding (or creep) under slow loading a – b < 0, velocity weakening: Large enough regions are locked in aseismic period, slip accumulates in earthquakes For many types of rocks (except clay minerals), static friction coefficient is 0.6 - 0.85. “Byerlee’s law” [1978]
Thermal weakening mechanisms activated at high slip rates - Flash heating of microscopic asperities Effective before bulk melting takes place - Thermal pressurization of pore fluid Effective if a fault is saturated with water - Melt lubrication Only after melt layer is developed - Thermal decomposition of minerals and production of weak materials Depending on the mineralogy of the host rock Flash heating and thermal pressurization have a potential to be universal weakening mechanisms during rapid slip.
Heterogeneity in the hydraulic diffusivity Slip distribution at z = 0, black lines every 1 sec during EQs and gray ones every 10 years The region more susceptible to thermal pressurization has larger displacements in model-spanning events. The slip deficit in the other region is filled with smaller and more frequent events.
Effect of heterogeneity in the hydraulic diffusivity on temperature distribution Temperature and effective normal stressevery 1 sec in a large event at z = 0 Fault temperature is highest not in the region of the largest slip. The fault area of highest temperature has intermediate level of slip, but high frictional resistance.