Download
1 / 22
220 likes | 343 Views
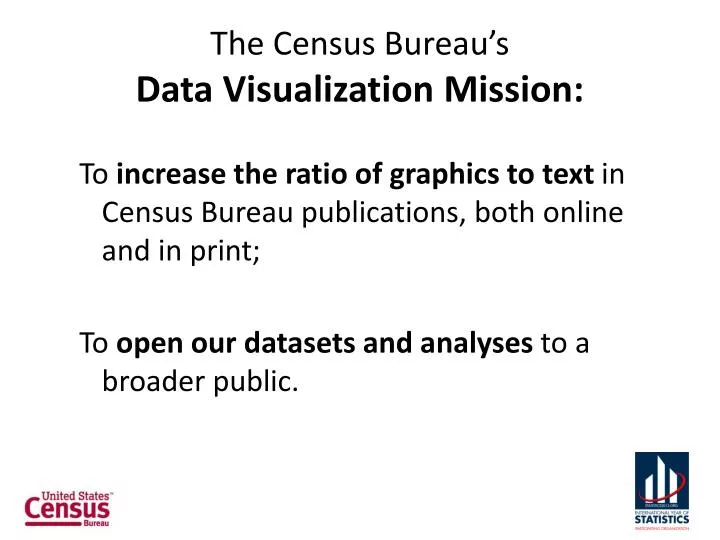
T he Census Bureau’s Data Visualization Mission:. To increase the ratio of graphics to text in Census Bureau publications, both online and in print; To open our datasets and analyses to a broader public. Data Visualization Team. 63 members from 23 Census areas.

E N D
The Census Bureau’s Data Visualization Mission: To increase the ratio of graphics to text in Census Bureau publications, both online and in print; To open our datasets and analyses to a broader public.
Data Visualization Team 63 members from 23 Census areas
Requirements for a Data Visualization of the Week • 1. Four or more dimensions of analysis, whether data or annotative • 2. Sufficient annotations to stand alone, without narrative support from any other product • 3. All direct statements in annotations must have passed statistical review • 4. Must comply with good visualization practices which present maximum relevant information with minimal cognitive load • 5. If multipage, must include a front page that presents an overview • 6. If multipage, must include intuitive index • 7. If interactive, must include intuitive controls • 8. Interactivity code must comply with security and browser standards (e.g. browser independence) • 9. Because interactivity – even so simple a thing as animation – comes with a cost in effort and time, interactivity must add value in both understanding and new dimensions of analysis • 10. The image should include Census Bureau branding • 11. Must comply with 508 rules • 12. Must make the dataset behind the visualization available in an excel file (or CSV)