Download
1 / 13
140 likes | 323 Views
2D Position Sensitive Detector for Plasma diagnosis. Cheon Jong-Kyu. Contents. Fusion reactor Plasma Diagnostics Charge exchange recombination spectroscopy Charge exchange neutral analyzer Visible spectrometer X-ray Crystal spectrometer

E N D
2D Position Sensitive Detector for Plasma diagnosis Cheon Jong-Kyu
Contents • Fusion reactor • Plasma Diagnostics • Charge exchange recombination spectroscopy • Charge exchange neutral analyzer • Visible spectrometer • X-ray Crystal spectrometer • 3D view of the x-ray imaging crystal imaging spectrometer • Position Sensitive Detector for X-ray Crystal spectrometer • Performance test at Alcator C-Mod tokamak(MIT)
Fusion reactor • Inertial confinement Trident laser facility at LANL (Los Alamos National Laboratory) using inertial confinement fusion • Tokamak Tokamak fusion test reactor at PPPL(Princeton Plasma PhysicsLaboratory )
Plasma Diagnostics for tokamak Layout of the horizontal ports for KSTAR diagnostics and for the main systems.
Charge exchange recombination spectroscopy • [Objectives]Measurement of ion temperature, toroidal & poloidal rotation velocities and impurity density. • [Principle]Neutral atom (H0) and impurity ion (Aq+) undergo a charge transfer that leaves the product ion in an excited state.H0 + Aq+ --> H+ + [A(q-1)+]*In usual JT-60U discharges, the source of neutral atom is a neutral beam for the plasma heating, and the reaction with C6+ is used for this measurement. This is because carbon is one of intrinsic impurities and they are fully stripped throughout the plasma volume. Emissions are excited at wavelengths long enough for making accurate Doppler broadening and shift measurements. • [Diagnostic Method]One of heating beams NB #14 is used for this measurement (see figures). Due to the above reaction, carbon ions near the neutral beam emit green light (529.2 nm at n=8-7 transition). The light is collected by a quartz lens onto fiber optics and is transmitted to spectrometers in the diagnostic room; then the spectrum is detected by an intensified CCD cameras for the subsequent analysis of Doppler broadening (--> temperature), Doppler shift (--> rotation velocity) and its area (--> impurity density). According to the ionization balance, there are C5+ ions in the edge region, which can emit at the same transition due to direct excitation by electrons (not by neutral beams). Therefore it is important to separate the spectrum by beam excitation from that by electron excitation. In order for this, CXRS system in JT-60U has an exclusive optics for the background spectrum.
Charge exchange neutral analyzer • [Objectives]Measure energy spectrum of charge-exchange neutral particles of energetic alpha particle and hydrogen isotopes (H, D, T) emitted from the plasma.[Detectors, Diagnostic Method]Energetic neutral particles entering the analyzer are ionized by stripping in a thin carbon foil. The energy and mass of secondary ions are resolved by a combination of magnetic and electrostatic fields (E//B type). Secondary ions are measured with detectors consisting of CsI(Tl) scintillators each connected to a photomultiplier tube (PMT). Tangential analyzer Vertical analyzer http://www-jt60.naka.jaeri.go.jp/diag/html/diag_35.html
Visible spectrometer • [Objectives]To observe spectral lines, bands and their spatial profile for study of atomic and molecular processes in the divertor plasmas. • [Diagnostic method]Emission collimated with lenses is transmitted through 16 optical fibers from the torus hall to a diagnostic room. The light from the optical fibers is dispersed with the spectrometer and the image-intensified CCD camera observes the image of the fibers. http://www-jt60.naka.jaeri.go.jp/diag/html/diag_30.html
X-ray Crystal spectrometer X-ray emitted from the shaded area of the plasma pass through beryllium window into a helium-filled tube and are Bragg reflected by the crystal onto the position-sensitive detector. Photons of different energies are focused to different detector points
3D view of the x-ray imaging crystal imaging spectrometer Horizontal XCS : the ion and electron temperature profiles Vertical XCS : spatial resolution in horizontal mid-plane of the KSTAR tokamak, the toroidal plasma rotation velocity
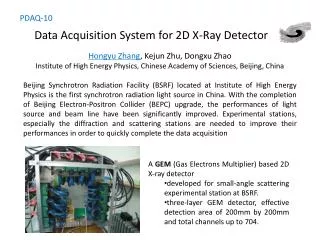
Position Sensitive Detector for X-ray Crystal spectrometer Spatial resolution : 0.5 mm Operating Voltage : 3350 V Window : Be 0.1 mm
Performance test at Alcator C-Mod tokamak(MIT) A spatially resolved image of Helium-like argon lines The measured photon count rate vs time. *ICRH(ion cyclotron resonance heating)
Electronics Electronics 2 segmented detector 800 k count/s
Plan for future • Electronics는 Trigger 신호에 의해 동작되므로 두 개 이상 독립된 시스템 가능하다 따라서, 하나의 검출기에 독립된 두개 이상의 검출 영역을 두어 한계 계수율의 제한을 높이려 한다. • 최적의 검출기 센서 영역의 패턴을 찾아 0.3 mm 이하의 분해능이 되도록 한다.