Download

1 / 21
210 likes | 365 Views
The Effect of Fuel Impact on Mixture Preparation in SI Engines with Port Fuel Injection. António L. N. Moreira João Carvalho Miguel R. O. Panão. IN+, Center for Innovation, Technology and Policy Research Mechanical Engineering Department Instituto Superior Técnico.

E N D
The Effect of Fuel Impact on Mixture Preparation in SI Engines with Port Fuel Injection António L. N. Moreira João Carvalho Miguel R. O. Panão IN+, Center for Innovation, Technology and Policy Research Mechanical Engineering Department Instituto Superior Técnico
16% of total HC emissions due to liquid films. - Cheng et al. (1993) - 15% of injected fuel remains liquidinside combustion chamber 1.5 increase factor in HC emissions between engine cold-start and heated engine. - Meyer and Heywood (1999) - COLD START AFTER WARM UP
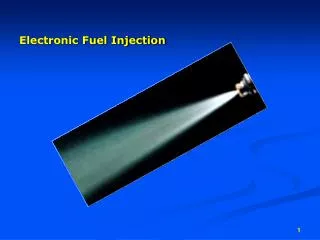
FilmEvaporation Vaporization/Boiling Transition Leidenfrost Arcoumanis and Chang, Experiments in Fluids, vol. 16, pp. 105-119, 1993. Nu = a Rem Prn Wep
To quantify the effects of all surface, flow and fluid properties on the heat transferred in PFI systems Nu = a Rem Prn Wep Jaq Ecw
Simultaneous measurements of droplet dynamics and surface thermal behaviour • Resistance = 8 – 12 tresponse 10 s • Signal gain = 300 • Temperature acquired at 50kHz • Electronic noise = 0.3ºC
FilmEvaporation Vaporization/Boiling Transition Leidenfrost Nu = a Rem Prn Wep Jaq Ecw New Correlation Panão and Moreira, Thermo- and fluid dynamics characterization of spray cooling with pulsed sprays, Experimental Thermal and Fluid Science, in Press.
To quantify the effects of all surface, flow and fluid properties on the heat transferred in PFI systems; • To quantify spatial and injection conditions effects in systems with simultaneous fuel injector activation (cold start and acceleration enrichment).
- 20 20 (mm) r = 2 mm Working Conditions Injection frequency = 10, 15, 20 and 30 Hz Duty Cycle = 0.05, 0.075, 0.1 and 0.15 (tinj = 5ms) Wall temperature = 125, 150, 175, 200 and 225ºC
Step 1 – Calculate Ensemble-Average Series Nseries Average over 70 Series ensemble-average series
Step 2 – Phase-Average Wall Temperature -5% of Tw(t=0) ensemble-average series valid injections (Nvinj)
Step 3 – Total Average Heat Flux Phase-Average Wall Temperature Transient Profile instantaneous heat flux CALCULATION Reichelt et al., Int. J. Heat Mass Transfer 45 (2002), pp579.
time-average heat flux Reichelt et al., Int. J. Heat Mass Transfer 45 (2002), pp579. Tw = 125ºC finj = 10Hz
r = 0 mm finj = 30 Hz tinj = 5 ms Panão and Moreira, Thermo- and fluid dynamics characterization of spray cooling with pulsed sprays, Experimental Thermal and Fluid Science, in Press.
To quantify the effects of all surface, flow and fluid properties on the heat transferred in PFI systems; • To quantify spatial and injection conditions effects in systems with simultaneous fuel injector activation (cold start and acceleration enrichment); • To develop a methodology to describe the overall thermal interaction acounting for the complex non-linear interactions within the area of impact.
Step 3 – Total Average Heat Flux Tw = 125ºC finj = 10Hz total average heat flux OVERALL BOILING CURVE
Step 4 – Spray Cooling Efficiency spray cooling efficiency
A new correlation for the heat transfer coefficient has been developed based on simultaneous measurement of the spray characteristics and surface thermal behaviour: A novel methodology is developed to quantify the heat removed a pulsed spray. Total average heat flux increases with injection frequency due to the associated increase of net mass flux. Nukiyama temperature is independent of injection frequency. Spray cooling efficiency is larger for CHF and lower injection frequencies.