Download
1 / 38
560 likes | 1.62k Views
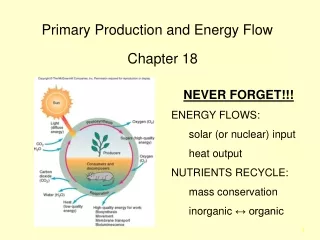
Primary Production and Energy Flow. Chapter 18. Outline. Introduction Terrestrial Primary Production Evapotranspiration Aquatic Primary Production Consumer Influences Trophic Levels/Dynamics. Introduction.

E N D
Primary Production and Energy Flow Chapter 18
Outline • Introduction • Terrestrial Primary Production • Evapotranspiration • Aquatic Primary Production • Consumer Influences • Trophic Levels/Dynamics
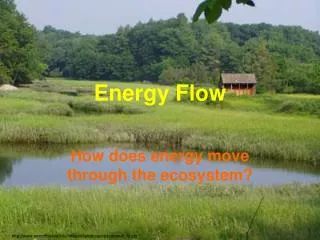
Introduction • The interactions between organisms and their environment are fueled by transformations of energy. • The source of that energy in most ecosystems is the sun.
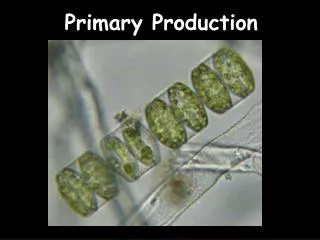
Introduction • Primary production: Fixation of energy by autotrophs in an ecosystem. • Autotroph – an organism that can synthesize organic molecules using inorganic molecules and energy from either sunlight (photosynthesis) or from inorganic molecules such as hydrogen sulfide (chemosynthesis).
Introduction • Rate of primary production: Amount of energy fixed over a given period of time. • Gross primary production: Total amount of energy fixed by autotrophs. • Net primary production: Amount of energy leftover after autotrophs have met their metabolic needs.
Introduction • Trophic Level: Position in a food web determined by number of energy transfers from primary producers to current level: • Primary producers (autotrophs) occupy first level. • Primary consumers (herbivores & detritivores) occupy second level. • Secondary consumers (carnivores) occupy third level. • Tertiary consumers occupy fourth level.
Patterns of Terrestrial Primary Production • Terrestrial primary production is limited by temperature and moisture.
Actual Evapotranspiration and Terrestrial Primary Production • Rosenzweig estimated influence of moisture and temperature on rates of primary production by plotting the relationship between annual net primary production and annual actual evapotranspiration (AET).
Actual Evapotranspiration and Terrestrial Primary Production • AET: Annual amount of water that evaporates and transpires off a landscape. • Cold dry ecosystems tend to have low AET. • Warm moist ecosystems tend to have high AET. • AET is affected by both temperature and precipitation.
Evapotranspiration and Terrestrial Primary Production • Generally, there is a positive relationship between net primary production and AET.
Evapotranspiration and Terrestrial Primary Production • Looking at variation within similar ecosystems: • Salafound east-west variation in primary production in grassland ecosystems correlated with rainfall.
Soil Fertility and Terrestrial Primary Production • Significant variation in terrestrial primary production can be explained by differences in soil fertility. • Leibig’s Law of the Minimum suggests that the single most limiting resource controls primary production.
Soil Fertility and Terrestrial Primary Production • Shaver and Chapin found arctic net primary production was twice as high on fertilized plots as unfertilized plots.
Soil Fertility and Terrestrial Primary Production • Bowman suggested N is main nutrient limiting net primary production in a dry tundra meadow, and N and P jointly limit production in a wet meadow.
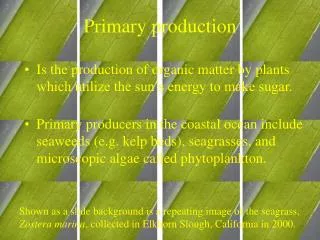
Patterns of Aquatic Primary Production • Aquatic primary production is generally limited by nutrient availability.
Patterns of Aquatic Primary Production • Several studies have found quantitative relationship between phosphorus and phytoplankton biomass.
Patterns of Aquatic Primary Production • Smith examined the relationship between phytoplankton biomass and the rate of primary production. • Strong positive correlation between chlorophyll concentrations and photosynthetic rates.
Patterns of Aquatic Primary Production • Whole lake experiments support the generalization that nutrient availability controls rates of primary production in freshwater ecosystems.
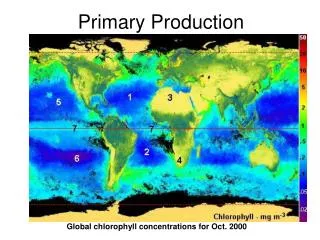
Global Patterns of Marine Primary Production • Highest rates of primary production by marine phytoplankton are generally concentrated in areas with higher levels of nutrient availability.
Global Patterns of Marine Primary Production • Highest rates found along continental margins. • Nutrient run-off from land. • Sediment disturbance • Open ocean tends to be nutrient poor. • Vertical mixing main nutrient source.
Global Patterns of Marine Primary Production • Graneli gathered results suggesting rate of primary production in Baltic Sea is nutrient limited. • Increased nutrients led to increased chlorophyll concentrations. • N appears to be limiting nutrient.
Global Patterns of Marine Primary Production • Residual Variation: Proportion of variation not explained by the independent variable. • Dillon and Rigler suggested environmental factors besides nutrient availability significantly influence phytoplankton biomass. • Intensity of predation on zooplankton.
Consumer Influences • Consumers can influence rates of primary production in aquatic and terrestrial ecosystems.
Consumer Influences • Bottom-Up Controls • Influences of physical and chemical factors of an ecosystem. • Top-Down Controls • Influences of consumers.
Lake Primary Production • Carpenter proposed piscivores and planktivorous fish can cause significant deviations in primary productivity. • Top-down
Lake Primary Production • Carpenter and Kitchell proposed the influence of consumers on lake primary productivity propagate through food webs. • Trophic Cascade Hypothesis
Lake Primary Production • Carpenter and Kitchell found that reduction in planktivorous fish populations led to reduced rates of primary production. • In presence of abundant, large herbivorous zooplankton, phytoplankton biomass and rate of primary production declined.
Lake Primary Production • In absence of planktivorous minnows, predaceous invertebrates became more numerous. • Feed on small zooplankton. • Leads to an increase in large zooplankton.
Primary Production on the Serengeti • McNaughtonestimated Serengeti grazers consume an average of 66% of annual primary production. • Rate of primary production in the Serengeti is positively correlated with rainfall quantity.
Primary Production in the Serengeti • Found grazers can increase primary production. • Increased growth rate. • Compensatory Growth • Lower respiration rate due to lower biomass. • Reduced self-shading. • Improved water balance due to reduced leaf area.
Primary Production in the Serengeti • In addition, McNaughton found compensatory growth highest at intermediate grazing intensities. • Light grazing insufficient to produce compensatory growth. • Heavy grazing reduces plant’s capacity to recover.
Trophic Levels • Energy losses limit the number of trophic levels in ecosystems. • With each transfer or conversion of energy, some energy is lost.
Trophic Dynamic View of Ecosystems • Lindeman concluded the ecosystem concept is fundamental to the study of trophic dynamics (energy transfer within an ecosystem). • Suggested grouping organisms within an ecosystem into trophic levels. • Each feeds on level immediately below.
Trophic Dynamic View of Ecosystems • As energy is transferred from one trophic level to another, energy is degraded: • Limited assimilation • Consumer respiration • Heat production
Trophic Dynamic View of Ecosystems • Energy quality decreases with each successive trophic level. • Pyramid-shaped energy distribution.
Energy Flow in A Temperate Deciduous Forest • Gosz studied solar energy flow in the Hubbard Brook Experimental Forest: • 15% reflected • 41% converted to heat • 42% absorbed during evapotranspiration • 2.2% fixed by plants as gross primary production • 1.2% used in plant respiration • 1% left for primary production
Energy Flow in A Temperate Deciduous Forest • 99% of solar energy unavailable for use by second trophic level. • Of the net primary production eaten by consumers, about 96% is lost as consumer respiration. • As energy losses between trophic levels accumulate, eventually there is insufficient energy left to support a viable population at a higher trophic level.