Download
1 / 31
310 likes | 455 Views
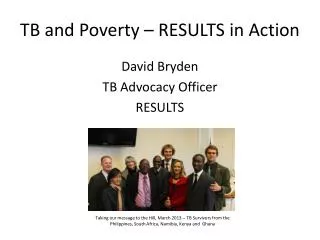
TB and Poverty. Gillian Mann. Overview. What do we mean by poverty and vulnerability? Higher risk of TB among the poor Lower access to TB services for the poor Is TB unusual with regard to poverty? What can be done? Where is there more information?.

E N D
TB and Poverty Gillian Mann
Overview • What do we mean by poverty and vulnerability? • Higher risk of TB among the poor • Lower access to TB services for the poor • Is TB unusual with regard to poverty? • What can be done? • Where is there more information?
The concepts of poverty and vulnerability Poverty • is more than economic poverty (living on ≤US$ 1 per day) • encompasses lack of opportunities, voice and representation, and vulnerability to shocks • is a major determinant of vulnerability to disease – especially TB
The relationship between poverty and TB The poor have • higher risk of infection • higher prevalence of disease • worse outcome of disease
Poor people face higher risk • TB has been long associated with poverty. • Seventeen of the twenty-two countries that account for the 80% world’s TB burden are classified as low income. • Poor and vulnerable people are much more likely to suffer from TB due to socioeconomic factors • Within countries the prevalence of TB is higher among vulnerable groups such as poor people and the homeless • Indigenous peoples suffer higher rates of TB than non-indigenous peoples in the same countries, e.g. • Canada: TB rates are approximately 10times higher among First Nations peoples and up to 90 times higher among the Inuit; • New Zealand, Pacific Islanders and Maoris have a 22.3 and 10.5 risk rate. • Kalaallit Nunaat, residents have a risk rate of 45 times that of Danish people
Poor People face higher risk • Poverty increases the risk of TB infection and disease and TB disease deepens poverty. • Deprivation associated with poverty, in terms of nutritional deficiencies and weak immune systems, overcrowded housing and lack of access to healthcare, contribute to risk of infection • Other factors associated with poverty, such as smoking, are high risk factors for TB
Access to services • Case detection in many countries is low because the poor cannot access TB services Symptoms recognised Patient delay Health care utilisation Patient delay Health system delay Active TB Diagnosis Infected Notification
How do we know the poor are not getting access? Actual number of missing chronic cough cases – 350 Actual number of missing smear positive TB cases – 42 Half of all smear positive cases of TB may be missing from the poorest areas
Access to services • The poor face significant costs and delays in accessing TB services; the burden of TB in their communities continues to increase • The process of accessing care is impoverishing • Papers: • Kemp et al. Can Malawi's poor afford free TB services? Patient and household costs associated with a TB diagnosis in Lilongwe. Bull World Health Organ 2006; 85(8) • Nhlema-Simwaka et al. Developing a socio-economic measure to monitor access to tuberculosis services in urban Lilongwe, Malawi. IJTLD 2007; 11(1):65-71
Costs of a diagnosis for poor and non poor Kemp JR, Mann GH et al Bulletin of the World Health Organisation 2007 85; 580-585.
DOTS since 2002 DOTS since 1992
People drop out of the diagnostic process: audit in Lilongwe, Feb-Aug 1995 499 suspects 466 “on-spot” 423“early morning” 413“next day spot” • 37% of people dropped out of the diagnostic process 404 result available 316 collected result
Inequity in the Health Sector • Inequality: Unequal outcomes; unequal access to health services • Inequity: Inequalities that are unjust • In 56 low and middle income countries (c. 50% of the world’s population) health inequality is rampant. In relation to the richest 20%, on average the poorest 20% : • Are twice as likely to have an infant die • Are three times as likely to see their children suffer stunted growth • Have an adolescent fertility rate three times higher • Health Sector contributes to this: • A poor pregnant woman is more than three times as likely to deliver at home • A poor child is half as likely to receive full basic immunisation • A poor woman of childbearing age is 40% less likely to practice contraception
Distribution of Funding Source: NCAER, New Delhi, India (Yazbeck A, Benefit incidence Analysis, Reaching the Poor 2004)
Use of Level of Care: India Source: Yazbeck A, Benefit incidence Analysis, Reaching the Poor 2004
A trial of transferring up-front, out-of-pocket expenditure from patients to TB dispensaries (funded through New Cooperative Medical Scheme in Hunan Province, China)
Hurdles faced by an average rural resident accessing TB treatment in Malawi NB: no user fees in public health facilities Source: Gillian Mann PhD Thesis University of Liverpool 2008
Potential effect of front-loading of sputum collection for smear microscopy
Potential effect of frontloading with same-day issue of results
What information is there: Guidelines for NTPs • Identification of the poor and vulnerable groups in the country/region served by the national TB control programme • Identification of the barriers to accessing TB services faced by the poor and vulnerable groups in the country/region • Identification of potential actions to overcome the barriers to access • Identification of situations and population groups requiring special consideration • Harnessing resources for pro-poor TB services • Assessment of the pro-poor performance of the national TB control programme and the impact of pro-poor measures http://www.stoptb.org/tbandpoverty/steps.asp WHO/HTM/TB/2005.352 May 2005
Summary • Poor people are more likely to have TB and less likely to receive care • We need to be sure that TB programmes are finding ways to reach the poor and to facilitate access to care • We need to make sure new tools are accessible to poor people
Poverty indicators/area – Lilongwe (Malawi) Mitsiriza Ngwenya
Poverty indicators/area – Lilongwe (Malawi) Mitsiriza Ngwenya
An example of a quantitative proxy measure B. Nhlema-Simwaka et al, IJTLD 2007;11(1):65-71
An example of a qualitative matrix B. Nhlema-Simwaka et al, IJTLD 2007;11(1):65-71