Download
1 / 9
100 likes | 292 Views
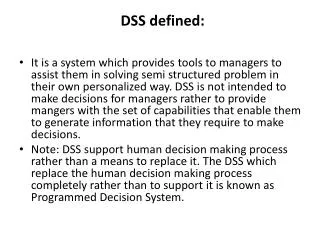
DSS Design. Management concept Obtaining results through people Obtaining results through information systems Steering activities: activities that change the existing ways of delivering goods and services, or create new ones. Types of DSS Data oriented (data analysis models)

E N D
Management concept • Obtaining results through people • Obtaining results through information systems • Steering activities: • activities that change the existing ways of delivering goods and services, or create new ones. • Types of DSS • Data oriented (data analysis models) • model oriented (if-then models) • data and model oriented (complex models) MTIS Approach
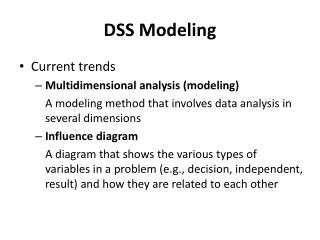
If-Then Models • DSS analysis • Influence diagram • requisite variety application • DSS design • variables -for-manipulation • dialog decision tree diagram • DSS generator-specific implementation principle
A. Prepare a problem narrative B. Classify variables Influence Diagram Analysis 1. Decision variables : under control of decision-maker 2. Outcome variables : results, measure of performance 3. Exogenous/assumptions : affect but are not affected 4. Intermediary variables : necessary to link other variables C. Draw influence diagram Decision variables Exogenous and Intermediary variables Outcome variables Influences D. Derive equations for modeling the problem
Decision variables Intermediate variables Sales Price Volume Investment Net Sales Unit Cost Direct Costs Outcome variables Mfg Overhead Net After Tax Cost of Sales Rate of Return Depreciation Gross Profit Exogenous/Assumption Admin Expenses Market Growth Net Before Tax Tax Rate Classification of Variables
Equations for Sales Price and Investment Decisions Volume = 15,000 * (1+Mkt Growth) - 6,666 * Sales Price Unit Cost = 1.3 - .00009 * Investment Net Sales = Sales Price * Volume Direct Costs = Unit Cost * Volume Mfg Overhead = .1 * Net Sales Cost of Sales = Mfg Overhead + Direct Costs Gross Profit = Net Sales - Cost of Sales Depreciation = Function(Investment) Admin Expenses = .04 * Net Sales Net Before Tax = Gross Profit - Admin Expenses - Depreciation Net After Tax = (1-Tax Rate) * NetBefore Tax Rate of Return = Function( Net After Tax, Depreciation, Investment)
Serial Diagonal ss ss ss Implementation Principle cell addresses macros ss ss ss many spreadsheets one spreadsheet 3-D ss ss ss 3-D cell addresses ss ss ss many spreadsheets