Download
1 / 38
380 likes | 556 Views
R in the Statistical Office: The UNIDO Experience. Valentin Todorov UNIDO v.todorov@unido.org. MSIS 2010 ( Daejeon , 26-29 April 2010). Outline . Introduction: the R Platform and Availability R Extensibility (R Packages) R in UNIDO statistical process: three examples

E N D
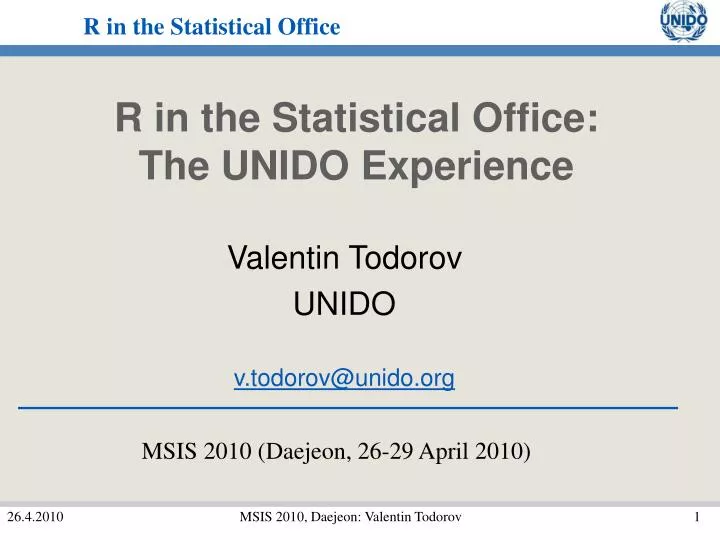
R in the Statistical Office: The UNIDO Experience Valentin Todorov UNIDO v.todorov@unido.org MSIS 2010 (Daejeon, 26-29 April 2010) MSIS 2010, Daejeon: Valentin Todorov
Outline • Introduction: the R Platform and Availability • R Extensibility (R Packages) • R in UNIDO statistical process: three examples • R as a Mediator (R Interfaces) • R as a Graphics Engine (R, LaTeX and Sweave) • Nowcasting tool for the Manufacturing Value Added (MVA) • Summary and Conclusions MSIS 2010, Daejeon: Valentin Todorov
What is R: Platform • R is “a system for statistical computation and graphics. It provides, among other things, a programming language, high-level graphics, interfaces to other languages and debugging facilities” • Developed after the S language and environment • S was developed at Bell Labs (John Chambers et al.) • S-Plus: a value added implementation of the S language- Insightful Corporation • much code written for S runs unaltered under R • Significantly influenced by Scheme, a Lisp dialect MSIS 2010, Daejeon: Valentin Todorov
What is R: History • Ihaka and Gentleman, University of Auckland (New Zealand) • 1993 a preliminary version of R • 1995 released under the GNU Public License • Now: R-core team consisting of 17 members including John Chambers • R provides a wide variety of statistical (linear and non-linear modelling, classical statistical tests, time-series analysis, classification, clustering, robust methods and many more) and graphical techniques MSIS 2010, Daejeon: Valentin Todorov
What is R: Availability • R is available as Free Software under the terms of the GNU General Public License (GPL) • R is available for: • wide variety of UNIX platforms (including FreeBSD and Linux) • Windows • MacOS • Add-on functionality is available in the form of packages from CRAN: http://cran.r-project.org/ MSIS 2010, Daejeon: Valentin Todorov
R Extensibility (R Packages) • One of the most important features of R is its extensibility by creating packages of functions and data. • The R package system provides a framework for developing, documenting, and testing extension code. • Packages can include R code, documentation, data and foreign code written in C or Fortran. • Packages are distributed through the CRAN repository – http://cran.r-project.org - currently more than 1300 packages covering a wide variety of statistical methods and algorithms. ‘base’ and ‘recommended’ packages are included in all binary distributions. MSIS 2010, Daejeon: Valentin Todorov
I. R as a mediator (R Interfaces) • Using a statistical system is not done in isolation • Import data for analysis • Export data for further processing use the right tool for the right work • Export results for report writing • Even in a small research department (UNIDO): SAS, Stata, Eviews, Octave, SPSS and R user MSIS 2010, Daejeon: Valentin Todorov
R as a mediator (R Interfaces) • Reading and writing data (text files, XML, spreadsheet like data, e.g. Excel • Read and write data formats of SAS, S-Plus, SPSS, EpiInfo, STATA, SYSTAT, Octave – package foreign • Emulation of Matlab – package matlab MSIS 2010, Daejeon: Valentin Todorov
R as a mediator: the foreign package library(foreign) df <- read.dbf(“myfile.dbf") # DBase df <- read.epiinfo("myfile.epiinfo") # Epi Info df <- read.mtp("myfile.mtp") # Minitab portable worksheet df <- read.octave("myfile.octave") # Octave df <- read.ssd("myfile.ssd") # SAS version 6 df <- read.xport("myfile.xport") # SAS XPORT file df <- read.spss("myfile.sav") # SPSS df <- read.dta("myfile.dta") # Stata df <- read.systat("myfile.sys") # Systat MSIS 2010, Daejeon: Valentin Todorov
R as a mediator (Accessing data on the Internet) • Reading data from an URL: • readLines() to read arbitrary text • read.table() to read a file with observations and variables (first line can be used for variable names) • read.csv() to read comma separated values. • Example (from Kleinman and Horton, 2009) ch <- url("http://www.math.smith.edu/sasr/testdata") df <- readLines(ch) ## df <- read.table("http://www.math.smith.edu/sasr/testdata") ## df <- read.csv("http://www.math.smith.edu/sasr/file.csv") MSIS 2010, Daejeon: Valentin Todorov
R as a mediator (XML processing) • Use package XML • xmlRoot() to open the connection to the file • xmlSApply() and xmlValue() are called recursively to process the file. • A character matrix is returned: columns correspond to observations and rows correspond to variables. • Example (from Kleinman and Horton, 2009) library(XML) surl <- http://www.math.smith.edu/sasr/datasets/help.xml doc <- xmlRoot(xmlTreeParse(surl )) tmp <- xmlSApply(doc, function(x) xmlSApply(x, xmlValue)) df <- t(tmp)[,-1] MSIS 2010, Daejeon: Valentin Todorov
SDMX example: Retrieve IMF/IFS data library(XML) surl <- "c:/download/Exrate4Unido.xml" doc <- as.list(xmlRoot(xmlTreeParse(surl))) ## Get the data for Korea kr <- doc[[which(xmlSApply(doc, function(x) xmlAttrs(x)[3]) == "Korea")]] xmlAttrs(kr) Frequency Database "A" "IFS" CountryName Country "Korea" "542" TS_Key Descriptor "542..RF.ZF..." "MARKET RATE, PERIOD AVERAGE" Units Scale "National Currency per US Dollar“ "None" MSIS 2010, Daejeon: Valentin Todorov
SDMX example: Retrieve IMF/IFS data (2) getExdata <- function(x) { out <<- rbind(out,as.numeric(xmlAttrs(x))) } out <- data.frame() xmlSApply(kr, getExdata) out … 27 1974 404.4725 28 1975 484.0000 29 1976 484.0000 30 1977 484.0000 31 1978 484.0000 32 1979 484.0000 33 1980 607.4325 • 1981 681.0283 … MSIS 2010, Daejeon: Valentin Todorov
R as a mediator (Databases) • Communication with RDBMS – ROracle, RMySql, RSQLite, RmSQL, RPgSQL, RODBC– large data sets, concurrency • Package filehash – a simple key-value style database, the data are stored on disk but are handled like data sets • Can use compiled native code in C, C++, Fortran, Java MSIS 2010, Daejeon: Valentin Todorov
R as a mediator: IDSB Example • Industrial Demand and Supply Balance (IDSB) Database - data sets based on ISIC Rev.3 at 4-digit level • Contains annual time series data (in current US dollars) for eight interrelated items • Data are derived from: • INDSTAT: Output data reported by National Statistical Offices • COMTRADE: UNIDO estimates for ISIC-based international trade data • A new, related to IDSB product will contain also Index of Industrial Production data (UNSD) MSIS 2010, Daejeon: Valentin Todorov
R as a mediator: IDSB Example (2) • The generation of the final data set involves • combination of two independent data sets (INDSTAT and COMTRADE), • conversion from one classification (SITC) to another (ISIC), • conversion of the monetary values from current national currency to current USD and other minor adjustments of the data. • Each single data set is verified thoroughly and its quality is guaranteed • But the verification of the synthesized data set is a serious challenge for the statistical staff of the Unit: A comprehensive screening data set is created MSIS 2010, Daejeon: Valentin Todorov
R as a mediator: IDSB Example (3) MSIS 2010, Daejeon: Valentin Todorov
R as a mediator: IDSB Example: R code ## First load the RODBC library. If not yet installed, install it using ## install.packages("RODBC") ## library(RODBC) ## Open the ODBC connection to the MDB file ’fname’ ## ch <- odbcConnectAccess("C:/work/idsb34screen.mdb") ## Create an SQL query of the type: ## "SELECT * FROM table_name WHERE where_condition" ## Execute the query and obtain the selected data in a dataframe ## sql <- "Select * from idsb34 where MXMARK <>’’" xdata <- sqlQuery(ch, sql) MSIS 2010, Daejeon: Valentin Todorov
II. R as a Graphics Engine • A natural way to visualize data are graphs and plots • Publication quality displays should be both informative and aesthetically pleasing (Tufte, 2001): • present many numbers in a small space; • encourage the eye to compare different pieces of data • The graphics have to be mingled with text explaining and commenting them • The standard approach: POINT & CLICK – WYSIWYG – COPY & PASTE • The proposed solution: R + LaTeX + BibTeX => Sweave PDF MSIS 2010, Daejeon: Valentin Todorov
The Example: International Yearbook of Industrial Statistics • A unique and comprehensive source of information, the only international publication providing worldwide statistics on performance and trends in the manufacturing sector. • Designed to facilitate international comparisons relating to manufacturing activity, industrial development and performance. • Data which can be used to analyze patterns of growth and related long term trends, structural change and industrial performance in individual industries. • A new graphical section presenting the major trends of growth and distribution of manufacturing in the world. MSIS 2010, Daejeon: Valentin Todorov
Yearbook Graphics: Requirements • The software tool we are looking for should fulfil as a minimum the following requirements • Create publication quality graphics • Interface easily with the other components of the production line (SAS , Sybase, .Net) • Comply with the submission guidelines of the publisher – e.g. the final document must contain only embedded fonts. • Provide means for easy text and image placement. Whenever the data are changed the document should be (preferably automatically) regenerated. • Use the same fonts in figure labels as in the main document • Easy to maintain and extend MSIS 2010, Daejeon: Valentin Todorov
The Components: R Graphics • One of the most important strengths of R – simple exploratory graphics as well as well-designed publication quality plots • The graphics can include mathematical symbols and formulae where needed • Can produce graphics in many formats: • On screen • PS and PDF for including in LaTex and pdfLaTeX or for distribution • PNG or JPEG for the Web • On Windows, metafiles for Word, PowerPoint, etc MSIS 2010, Daejeon: Valentin Todorov
R Graphics: basic and multipanel plots (trellis) MSIS 2010, Daejeon: Valentin Todorov
R Graphics: parallel plot and coplot MSIS 2010, Daejeon: Valentin Todorov
The Components: TeX and LaTeX • TeX: a typesetting system (computer program) for producing nicely printed, publication quality output, freely available: Donald E. Knuth, 1974 • LaTeX: a component designed to shield the author from the details of TeX; Lamport (1994) • Available for free from http://www.latex-project.org/ftp.html for Linux, MacOs and Windows. • BibTeX: A simple tool to create a bibliography in a LaTeX document • a uniform style is achieved, which easily can be replaced by another • a unified library of references shared among publications and authors MSIS 2010, Daejeon: Valentin Todorov
The Components: Sweave • A suitable tool that allows to embed the code for complete data analysis in documents (see Leisch, 2002) • Create dynamic reports, which can be updated automatically if data or analysis change • The master document (.Rnw) contains: • the necessary programming code for obtaining of the graphs, tables, etc. written in R • the text written in LaTeX • The document is run through R • all the data analysis is performed on the fly • the generated output - tables, graphs, etc. is inserted into the final LaTeX document. MSIS 2010, Daejeon: Valentin Todorov
III. Nowcasting MVA for Cross-country Comparison • UNIDO maintains a unique industrial statistics database INDSTAT) – updated regularly with data collected from NSOs • A separate database – compilation of statistics related to MVA – growth rate and share in GDP • Published in the International Yearbook of Industrial Statistics and on the statistical pages of the UNIDO web site • For current economic analysis it is crucial that the Yearbook presents data for the most recent years MSIS 2010, Daejeon: Valentin Todorov
Nowcasting MVA: The Model • The database consists of annual values of MVA and GDP at constant 2000 prices for around 200 countries • GDP data are available up to the current year: • For earlier years the actual GDP values are used • For the most recent one or two years the GDP values are derived from the nowcasts of GDP growth rates reported in the World Economic Outlook of IMF (see Artis, 1996) • MVA – a time-gap of at least one year: nowcasting • MVA is strongly connected to the GDP • this suggests to nowcast MVA on the basis of the estimated relationship between contemporaneous values of MVA and GDP MSIS 2010, Daejeon: Valentin Todorov
Nowcasting MVA: The Model (2) • We consider models based on the following general representation of MVA where the MVA growth rate is modelled as and ei,t is white noise. • This general model can be specialized down to four different models (see Boudt, Todorov and Upadhyaya, 2009) MSIS 2010, Daejeon: Valentin Todorov
Nowcasting MVA: Estimation MSIS 2010, Daejeon: Valentin Todorov
Nowcasting MVA: Estimation • The standard OLS estimator may be biased because of • violation of the assumption of exogeneity of the regressors with respect to the error term • presence of outliers in the data • What are outliers: • atypical observations which are inconsistent with the rest of the data or deviate from the postulated model • may arise through contamination, errors in data gathering, or misspecification of the model • classical statistical methods are very sensitive to such data • For this reason we also consider a robust alternative to the OLS estimator, namely the MM estimator MSIS 2010, Daejeon: Valentin Todorov
Nowcasting MVA: MM-Estimator • Robust methods: produce reasonable results even when one or more outliers may appear in the data • The MM regression estimator is a two step estimator: • First step – LTS (Least Trimmed Squares) – estimates the parameter vector that minimizes the sum of the 50% smallest square residuals • This estimate is used as a starting value for M-estimation where a loss function is minimized that downweights outliers • Has a high efficiency under the linear regression model with normally distributed errors • Because of the LTS initialization it is highly robust • For details see Maronna et al (2006) MSIS 2010, Daejeon: Valentin Todorov
Nowcasting MVA: MM-Estimator in R • Package robustbase: • Provides “essential robust statistics” within R available in a single package • Provides tools that allow analyzing data with robust methods: • Regression including model selection • Multivariate statistics • Aims to cover the book of Maronna et al (2006) MSIS 2010, Daejeon: Valentin Todorov
Summary and Outlook • An increasing demand for statistical tools which combine ease of use and availability of newest analytical methods. • Provided by the flexibility of the statistical programming language and environment R • Illustrated by examples from the statistical production process of UNIDO • Future development: • R for survey data analysis • Detection of outliers in survey data with R • Imputation of missing values in multivariate data with R MSIS 2010, Daejeon: Valentin Todorov