Download
1 / 48
480 likes | 677 Views
Young Drivers II : Research & Solutions. Washington Teen Driving Task Force Olympia, WA September 9, 2009. Why Are Teens SO Over-represented? Development Solutions. Why Are Teens SO Overrepresented?. Young Driver Crash Risk. Driver Characteristics. Driver Behaviors (Unsafe).

E N D
Young Drivers II: Research & Solutions Washington Teen Driving Task Force Olympia, WA September 9, 2009
Why Are Teens SO Over-represented? Development Solutions
Why Are Teens SO Overrepresented?
Young Driver Crash Risk Driver Characteristics Driver Behaviors (Unsafe) Crash Social Environment Driving Environment Crash risk is determined by a variety of factors that are all interrelated. This makes it difficult to pinpoint specific, isolated causes of collisions. Source: Shope & Bingham (2003)
Research shows that teens… • Drive with smaller gaps between vehicles (thus more rear-end collisions) (Gregersen & Bjurulf; Williams, Ferguson, & Shope) • Use seatbelts less often (Engstrom, et al.; Gregersen & Bjurulf; Masten) • Are involved in more single-car collisions (Engstrom, et al.; Gregersen; Ulmer, Williams, & Preusser) • Are overrepresented in nighttime and weekend collisions. (Engstrom, et al.; Gregersen; Gregersen & Berg; IIHS; Ulmer, et al.) • Are more likely to • be at fault in a collision (IIHS; Kim, Li, Richardson, & Nitz; Ulmer, et al.) • be speeding(Engstrom, et al.; Gregersen; Gregersen & Bjurulf; IIHS; Masten; Williams, et al.) • accrue moving violations(Ulmer, et al.) • carry teenage passengers(Ulmer, et al.) • violate signs and signals(Masten, Williams, et al.) • overtake vehicles in a risky manner(Masten, Williams, et al.) • fail to yield to pedestrians (Masten, Williams, et al.)
But Why? • Inexperience • Immaturity(Development) These factors interact with each other!
Inexperience • Not enough time behind the wheel • Teens overestimate driving skill • Teens underestimate collision risks A BAD Combination(!) that leads to: • Reduced hazard perception • Slower reaction time • Underdeveloped vehicle maneuvering and visual scanning skills • These factorsboost collision risk!
INEXPERIENCE Cooper, Pinili, & Chen (1995) looked at drivers ages 16-55. • Collision rates for all new drivers were greatest during the 1st year of licensure. • 16-20 year olds had the highest at-fault collision rate during the 1st year of licensure. • As age increased for novice drivers, initial collision risk decreased.
Novice Drivers • Novice drivers in every age group are at elevated risk for a crash in the first 6 months of licensure – butteens even more so! [Mayhew, Simpson, & Pak (2003); McCartt, Shabanova, & Leaf (2003); Cooper, Pinili, & Chen (1995)]. • Thus, age (i.e., maturity) and experience are important factors that coincide to determine driver crash risk.
Mental Workload • Driving is a complex, mentally demanding task, requiring higher level cognitive, perceptual, & motor skills. • Over time, the driving task becomes more ‘automatic’, decreasing the workload demands on the brain (Mourant & Rockwell; Quimby & Watts).
Mental Workload(cont’d) “These results [visual scanning studies] indicate that the first few times behind the wheel almost all of the information processing capacity is absorbed in simply maintaining the car’s position in the lane. As experience is gained, peripheral vision is used more to locate the vehicle in the lane, with fixations focused further down the road to allow more time to process information that becomes of increasing relevance as the vehicle’s speed increases.” (L. Evans)
Visual Scanning • Young drivers are less able to scan wider ranges on the roadway than older drivers. • look closer to the front of the vehicle and to the right • focus on keeping the vehicle in the lane • With increased experience, drivers are better able to focus eye fixations, rely on peripheral cues, and scan wider areas. (Masten, 2004; Evans, 1991).
Scanning(cont’d) “The relative ineffectiveness of scanning patterns of the novice drivers probably accounts for Summala and Naatanen’s [1974] finding that, even when specifically instructed to pay attention to road signs, inexperienced drivers miss significantly more signs than experienced drivers. Brown [1982] reports that young drivers are relatively poor at identifying distant hazards, although they compare well with older drivers in identifying near hazards.” (L. Evans)
Brain Development • PreFrontal cortex (PFC)development continues into our mid-20’s. This lobe is responsible for (among other functions): • Motor control • Problem solving/judgment • Impulse control • Memory • Language
Brain Development(continued) • Eby & Molnar (1998) • Short-term memory continues to develop until age 17, responsible for “decision making, reasoning, or understanding a traffic safety message.” • Ability to filter attention and to concentrate for long periods of time develops further during the ages 16-20.
RECENT FINDINGS • Giedd et al (1999) and Sowell et al (1999) • MRI studies confirm that adolescent brain development may lie behind the behaviors widely observed regarding teen drivers, i.e., risk-taking • Two waves of vigorous cortical growth – early childhood (0-3 years) and pre-adolescence (10-13) years
RECENT FINDINGS (cont’d) • Three year-old brain has more neurons than adult brain (~100 billion), with intermittent growth of dense synaptic networks (> adults) followed by ‘pruning’ (“use it or lose it”) • Pre-adolescent brains undergo renewed synaptogenesis, especially in the PFC, followed by pruning toward the end of puberty
RECENT FINDINGS (cont’d) • During the early stages of puberty, the amygdala (part of limbic system that mediates such emotions as fear) takes over executive functions normally assumed by PFC (owing to rapid pruning and myelinization in PFC) • At this stage, then, adolescents are, in a real sense, ‘thinking’ with their emotions!!
RECENT FINDINGS (cont’d) • Winter (2008): “During childhood, the brain grows an excessive number of connections between brain cells. At about year 11 or 12, a young person begins to lose or ‘prune back’ a substantial fraction of these connections. This loss is healthy in the long run and is a vital part of growing up. The pruning process clears out unneeded wiring to make way for more efficient and faster information-processing as we become adults. And it promotes building the long chains of nerve cells that are required for the more demanding problem-solving of adulthood. And the pruning process appears to follow the principle of ‘use-it-or-lose-it,’ according to experts. Thus, neural connections or circuitry that gets exercised as we grow up are retained, while the connections that are not activated or used, get pruned away. Dr. Giedd refers to this process in this way: ‘Ineffective or weak connections are pruned in much the same way a gardener would prune a tree or bush, giving the plant the desired shape’.”
Winter (cont’d) • “This brain maturation tends to occur from the back of the brain to the front. So the front region of the brain, known as the prefrontal cortex, which is responsible for high-level reasoning and decision-making, does not become fully mature until around the early to mid 20s. “The prefrontal cortex is the part of the brain that enables a person to think clearly, to make good decisions and to control impulses. It is primarily responsible for how much priority to give incoming messages like 'Do this now' versus 'Wait! What about the consequences?‘ Because the emotional, ‘Do this now’ regions, predominantly located behind the front of the brain, have progressed with the pruning process, it is difficult for the ‘Wait’ part of the brain to exert much influence. As Psychologist Laurence Steinberg sees it, a teenager's brain ‘has a well-developed accelerator but only a partly developed brake’.”
RECENT FINDINGS (cont’d) • Teens may also be more drawn to stimulus-seeking and risky behaviors because of different sensory-perception and social-development needs than adults • Less susceptible to awareness of alcohol or drug effects than adults • More swayed by and drawn to peer interactions • Alcohol / drugs reduce social inhibitions more powerfully for teens than for adults
RECENT FINDINGS: SUM • Thus, risk-taking, stimulus-seeking, and peer-centric behavior of teens is powerfully driven by developmental events in the PFC.
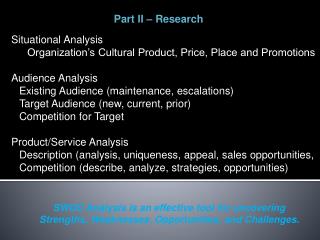
Part Two Possible Solutions Intermediate Driver Licensing (IDL) Traffic Safety Education Parental Involvement
IDL Research • National Safety Council (2003). • 12 study review- reduction in teen collision rates of 33% • Hartling, et al. (2006). • 13 study review- for 16 year-olds, collision rates decreased by 31%
IDL in Washington • Learner Phase- 6 months • 50 hours of supervised practice (10 at night), pass TSE course, clean driving record • Intermediate License • First 6 months, no passengers under 20, next 6 months, only 3 passengers under 20 • Cannot drive from 1:00 AM to 5:00 AM • Full license (at age 18 can get a full license without IDL)
Has IDL Worked in Washington? YES! And now a look at the data…
The Future • Need to change the IDL restrictions • Nighttime restrictions starting at 9:00 or 10:00 PM • Allow only one passenger under 20 • Extend the provisional phase until age 18 Source: IIHS (2005)- guidelines for an optimal GDL system • Overall, IDL has made a difference and needs to be maintained in WA to address the teen driver problem!
Traffic Safety Education • Lack of evidence showing positive effects of traditional traffic safety education curricula. • New Curricula Show Promise! • Europe- Project GADGET • Oregon State
Europe- Project GADGET • Project in the 1990’s. • Siegrist (1999). A new curriculum should expand from knowledge and skills of vehicle maneuvering and mastery of traffic situations, to include information about driving goals and context, as well as goals for life, risk awareness, and self-evaluation. • Focus on higher order cognitive skills!
GADGET Project Results • Finland • Collision rates decreased for 18-19 year olds. • Males 18-20 had 25% fewer collisions per licensed drivers, females 18% fewer. • Denmark • Overall reduction of 7%, equating to 50-150 lives saved per year. • Majority of reductions during first year of licensure!
Oregon State • Sponsored by ODOT • 10 Modules, consisting of one classroom lesson, a 30 min driving lesson, and required home practice • Uniting Driver & Vehicle • Knowing Where You Are • Your Are In Control • Searching for LOS-POT’s • You Control the Intersection • Space Management, The Deadly D’s • Interacting with Others • Practicing Your Skills • Managing Driver, Vehicle & Environmental Risks • Putting it All Together (more info: http://www.otsea.org) • First Lesson is Parents’ Night- Mandatory!! Review course outline, OR state laws, etc.
OR State Results • 42.6% reduction in fatal collisions involving 16 year old drivers (1998 vs. 2004) • 16-19 year olds who completed the course (with 50 hours behind the wheel): • 11-21% lower collision rate • 39-57% lower traffic conviction rate • 51-53% lower license suspension rate (all compared to those who had 100 hours of training just with their parents)
Parents and Teens Beck et al (2001): “More frequent parental supervision and restricted teen access to a car were associated with less likelihood of teens speeding and more likelihood of using seat belts.” • A majority of parents of teens who drink and drive, who ride with other teen drinking-drivers, who drive aggressively or distractedly, or who run stop signs/signals are unaware that their children engage in these driving behaviors.
Parents’ Influence • Survey by SADD & Liberty Mutual Group (2004) • 59% of high school aged drivers indicated their parents had the greatest influence on their driving. • 67% of respondents reported speeding, 62% reported cell phone use while driving, and 33% reported seat belt non-use. • 48% indicated their parents sped, 62% indicated their parents used cell phones while driving, and 31% indicated their parents did not use a seat belt.
Parents and Teens(cont’d) • Hortos et al (2002): Higher-risk teen drivers are three times more likely to report low parental monitoring and twice as likely to report minimal parental restriction. • Bottom Line: Parents are a critical link in promoting safe driving among teens, but many are barely engaged in monitoring or restricting the driving behaviors of their children.
Parents and Teens(cont’d) • Simons-Morton et al (2006 review) • Parent-supervised practice was not shown to be effective in early studies • More recently, studies on the early phase of ‘independent’ teen driving (i.e., post-IDL) have demonstrated that parental monitoring significantly reduces crash risks for teen drivers.
“Checkpoints” (CT) BehavioralContract • Parent-Teen “Driving Agreement” for communicating parental concerns and offering effective oversight/limits. • Study authors: • Mailed (I) parents ‘persuasive communications’ on risks of teen driving (vs. (C) general driving & vehicle maintenance info) • Compared family-imposed driving limits at 3 months, 6 months, and 12 months
Checkpoints (cont’d) Results • Families in (I) group showed “significantly greater limits on high-risk teen driving conditions” than (C) group • (I) Teens had significantly fewer traffic violations • However, no difference in crash frequency
Dick Doane 360-586-3866 ddoane@wtsc.wa.gov Heather Knous-Westfall 360-586-3348 hknous@wtsc.wa.gov