Download
1 / 2
20 likes | 179 Views
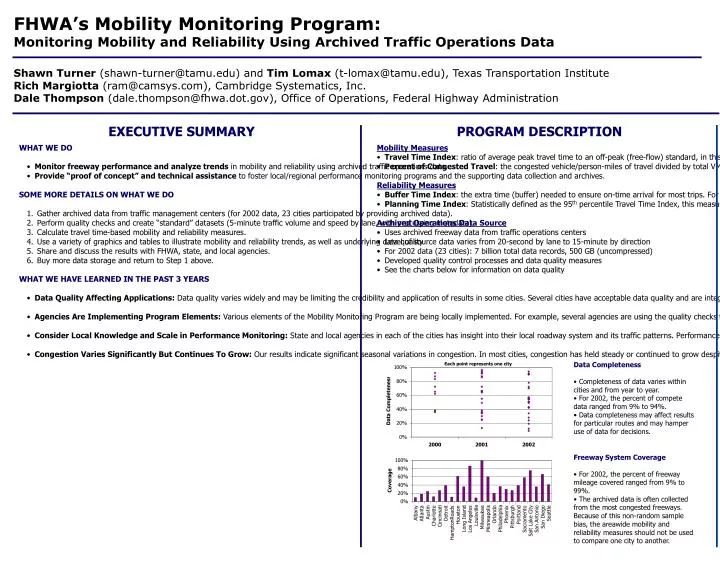
FHWA’s Mobility Monitoring Program: Monitoring Mobility and Reliability Using Archived Traffic Operations Data Shawn Turner (shawn-turner@tamu.edu) and Tim Lomax (t-lomax@tamu.edu), Texas Transportation Institute Rich Margiotta (ram@camsys.com), Cambridge Systematics, Inc.

E N D
FHWA’s Mobility Monitoring Program: Monitoring Mobility and Reliability Using Archived Traffic Operations Data Shawn Turner (shawn-turner@tamu.edu) and Tim Lomax (t-lomax@tamu.edu), Texas Transportation Institute Rich Margiotta (ram@camsys.com), Cambridge Systematics, Inc. Dale Thompson (dale.thompson@fhwa.dot.gov), Office of Operations, Federal Highway Administration EXECUTIVE SUMMARY PROGRAM DESCRIPTION • WHAT WE DO • Monitor freeway performanceand analyze trends in mobility and reliability using archived traffic operations data. • Provide “proof of concept” and technical assistance to foster local/regional performance monitoring programs and the supporting data collection and archives. • SOME MORE DETAILS ON WHAT WE DO • Gather archived data from traffic management centers (for 2002 data, 23 cities participated by providing archived data). • Perform quality checks and create “standard” datasets (5-minute traffic volume and speed by lane, with processing metadata). • Calculate travel time-based mobility and reliability measures. • Use a variety of graphics and tables to illustrate mobility and reliability trends, as well as underlying data quality • Share and discuss the results with FHWA, state, and local agencies. • Buy more data storage and return to Step 1 above. • WHAT WE HAVE LEARNED IN THE PAST 3 YEARS • Data Quality Affecting Applications: Data quality varies widely and may be limiting the credibility and application of results in some cities. Several cities have acceptable data quality and are integrating the archived data and performance measures into key decision-making processes. In some cities, limited roadway coverage precludes certain analyses. In other cities, incomplete or inaccurate data limits its credibility and hampers use of the data for decisions. • Agencies Are Implementing Program Elements: Various elements of the Mobility Monitoring Program are being locally implemented. For example, several agencies are using the quality checks for their data archives. Other agencies have adopted some of the analysis techniques and/or performance measures. • Consider Local Knowledge and Scale in Performance Monitoring: State and local agencies in each of the cities has insight into their local roadway system and its traffic patterns. Performance monitoring programs should originate from these local areas and at a scale appropriate for local decisions. However, there is a need to monitor performance at a national level as well, and standardized reporting would greatly enhance this ability. • Congestion Varies Significantly But Continues To Grow: Our results indicate significant seasonal variations in congestion. In most cities, congestion has held steady or continued to grow despite a sluggish economy. • Mobility Measures • Travel Time Index: ratio of average peak travel time to an off-peak (free-flow) standard, in this case 60 mph for freeways. For example, a value of 1.20 means that average peak travel times are 20% longer than off-peak travel times. • Percent of Congested Travel: the congested vehicle/person-miles of travel divided by total VMT/PMT. A relative measure of the amount of travel affected by congestion. • Reliability Measures • Buffer Time Index: the extra time (buffer) needed to ensure on-time arrival for most trips. For example, a value of 40% means that a traveler should budget an additional 8 minute buffer for a 20-minute average peak trip time to ensure 95% on-time arrival. • Planning Time Index: Statistically defined as the 95th percentile Travel Time Index, this measure also represents the extra time most travelers include when planning peak period trips. For example, a value of 1.60 means that travelers plan for an additional 60% travel time above the off-peak travel times to ensure 95% on-time arrival. • Archived Operations Data Source • Uses archived freeway data from traffic operations centers • Level of source data varies from 20-second by lane to 15-minute by direction • For 2002 data (23 cities): 7 billion total data records, 500 GB (uncompressed) • Developed quality control processes and data quality measures • See the charts below for information on data quality • Data Completeness • Completeness of data varies within cities and from year to year. • For 2002, the percent of compete data ranged from 9% to 94%. • Data completeness may affect results for particular routes and may hamper use of data for decisions. • Freeway System Coverage • For 2002, the percent of freeway mileage covered ranged from 9% to 99%. • The archived data is often collected from the most congested freeways. Because of this non-random sample bias, the areawide mobility and reliability measures should not be used to compare one city to another.
Albany – New York State DOT Atlanta – Georgia DOT Austin – Texas DOT Charlotte – North Carolina DOT Cincinnati – ARTIMIS and Ky. Transp. Cabinet Detroit – Michigan DOT Hampton Roads – Virginia DOT and UVA Houston – Texas DOT Los Angeles – Caltrans and UC-Berkeley Louisville – Kentucky Transportation Cabinet Milwaukee – Wisconsin DOT Minneapolis-St. Paul – Minnesota DOT and UM-Duluth Northern Virginia – Virginia DOT and UVA Orlando – Florida DOT Philadelphia – Mobility Technologies Phoenix – Arizona DOT Pittsburgh – Mobility Technologies Portland – Oregon DOT Sacramento – Caltrans and UC-Berkeley Salt Lake City – Utah DOT San Antonio – Texas DOT San Diego - Caltrans Seattle – Washington State DOT and UW Participating Cities and Agencies (2002 data): Research Sponsored By: Research Conducted By: Cambridge Systematics, Inc. Office of Operations, Federal Highway Administration • A Tale of Traffic in Two Cities: Austin, Texas vs. Los Angeles, California • The chart below contrasts the congestion levels in Austin, Texas with those in Los Angeles, California. The time-of-day chart clearly shows the morning and evening peak periods in both cities. The intensity of congestion (magnitude of the travel time index) and the duration of congestion (width of the “hump”) is also apparent. The morning peak period in Los Angeles is nearly as severe as the evening peak, but Austin’s morning peak is only half as severe as their evening peak. • Relationships between Mobility and Reliability • The chart shows the Travel Time Index (a measure of mobility) graphed against the Buffer Time Index for all freeway routes in two different cities. Preliminary research has shown a correlation between mobility levels and travel reliability. Although it may appear intuitive that more congested roads have less reliable travel times, our research is suggesting that this relationship varies depending upon the coverage and “aggressiveness” of traffic operations programs. That is, effective traffic operations may have a significant impact in improving travel reliability in addition to improving mobility. • For more information, see http://mobility.tamu.edu/mmp SELECTED FINDINGS • Each year, the Mobility Monitoring Program prepares a performance report for each city represented in the Program. The city reports are about 10 to 12 pages in length, and include a variety of charts and tables that describe the mobility and reliability trends for that specific city, both at the areawide level as well as for each directional route that is monitored. Selected graphics from these city reports are shown below to illustrate key findings. • Ramp Metering Operations in Minneapolis-St. Paul • The trends chart below reflects the changes to ramp metering in Minneapolis-St. Paul from 2000 through 2002. The freeway ramp metering system was disabled in late 2000 as part of an experiment mandated by the state legislature. After the experiment, freeway ramp metering was continued in early 2001, but in a less aggressive manner that took ramp and surface street delay into greater consideration. The trends chart indicates that freeway mobility and reliability has not returned to the levels experienced prior to the ramp meter experiment.