Download
1 / 19
240 likes | 446 Views
NAVIGATION TRAINING Section 9 Tides. Table of Contents. Section 1 Types of Navigation Section 2 Terrestial Coordinates Section 3 Charts Section 4 Compass Section 5 Nautical Publications Section 6 Navigational Aids. Table of Contents. Section 7 Buoyage

E N D
NAVIGATION TRAINING Section 9 Tides
Table of Contents • Section 1 Types of Navigation • Section 2 Terrestial Coordinates • Section 3 Charts • Section 4 Compass • Section 5 Nautical Publications • Section 6 Navigational Aids
Table of Contents • Section 7 Buoyage • Section 8 Position Lines and Fixes • Section 9 Tides • Section 10 Currents • Section 11 Weather
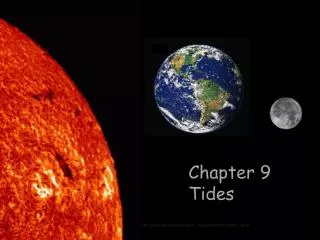
Tides Defined • Tides are the vertical rise and fall of the ocean level due to the gravitational and centrifugal forces between the earth and the moon, and to a lesser extent, the sun.
Spring Tides • When the tidal effects of the sun and the moon act in concert.
Neap Tides • When the tidal effects of the sun and the moon are in opposition to one another.
Tidal Reference Planes • Mean high-water springs (MHWS) • average height of all spring tide high-water levels • Mean higher high water (MHHW) • average of the higher of the high-water levels each tidal day, 19-year period • Mean high water (MHW) • average of all high-tide water levels, 19-year period • Mean high-water neaps (MHWN) • average recorded height of all neap tide high-water levels
Tidal Reference Planes • Mean low-water neaps (MLWN) • average recorded height of all neap tide high-water levels • Mean low water (MLW) • average of all low-tide water levels, 19-year period • Mean lower low water (MLLW) • average of the lower of the low-water levels each tidal day, 19-year period • Mean low water springs (MLWS) • average of all spring tide low-water levels
Tidal Reference Planes Height marked on chart Depth marked on chart
Tidal Patterns • In general in most of the world, the tides go up and down on a semi diurnal curve
Tidal Patterns in the Georgia Strait • With the tidal waters of the Georgia Strait being restricted north and south of Vancouver Island, a stand of higher water occurs between one of the two high waters. • The result is shown:
Calculating Rise of Tide • Q. If a low water was at 0600, with a height of 0.2 metres, and the next high water was at 1200 , with a height of 5.6 metres, what would be the approximate rise of tide and therefore approximate height of tide if your vessel was setting out at 0900.
Calculating Rise and Height of Tide A. 1200 LT High water 5.6 m 0600 LT Low water 0.2 m 6.00hrs Range 5.4 m 0900 LT 0600 LT Low water 0.2 m 3.00 hrs Approximate rise of tide is (3hrs/6hrs) x 5.4m = 2.7 m Approximate height of tide above chart datum, if your vessel was setting out at 0900 would be : Ht of LW (0.2m) + rise of tide (2.7m) = 2.9 m.
Calculating Rise of Tide • In this case allow only 2.5 metres. Always allow less rise of tide close to low water due to the rate of change of height being least close to time of low water (and high water).
IMPORTANT NOTICE At best, tidal prediction is a chancy business. It relies on field measurements and data collection that can be subject to any of several kinds of errors. Typographical errors, programming errors, and numerous weather and human activity error sources can contribute to a rather large level of predictive uncertainty.