Download
1 / 1
10 likes | 138 Views
PID Control. Brian MacAllister Department of Physics, Bridgewater State College -- Bridgewater MA, 02325 Mentor: Dr. Edward Deveney. Abstract

E N D
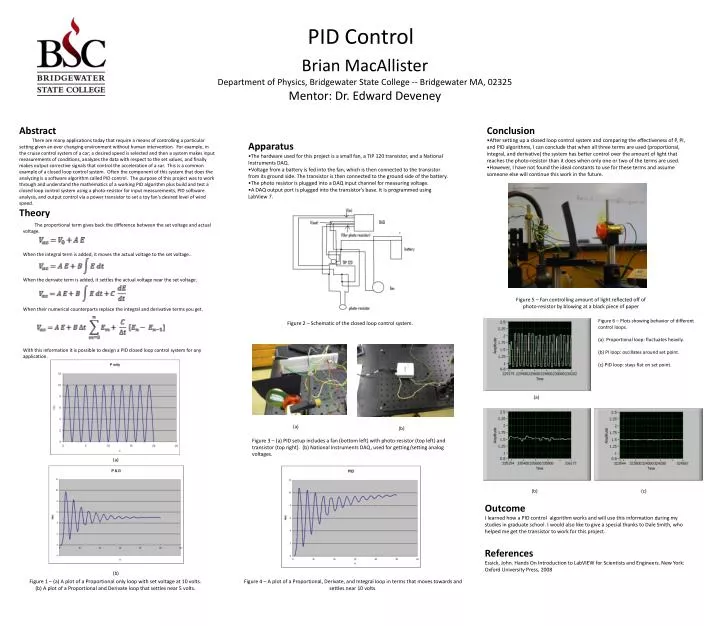
PID Control Brian MacAllister Department of Physics, Bridgewater State College -- Bridgewater MA, 02325 Mentor: Dr. Edward Deveney Abstract There are many applications today that require a means of controlling a particular setting given an ever changing environment without human intervention. For example, in the cruise control system of a car; a desired speed is selected and then a system makes input measurements of conditions, analyzes the data with respect to the set values, and finally makes output corrective signals that control the acceleration of a car. This is a common example of a closed loop control system. Often the component of this system that does the analyzing is a software algorithm called PID control. The purpose of this project was to work through and understand the mathematics of a working PID algorithm plus build and test a closed loop control system using a photo-resistor for input measurements, PID software analysis, and output control via a power transistor to set a toy fan's desired level of wind speed. • Conclusion • After setting up a closed loop control system and comparing the effectiveness of P, PI, and PID algorithms, I can conclude that when all three terms are used (proportional, integral, and derivative) the system has better control over the amount of light that reaches the photo-resistor than it does when only one or two of the terms are used. • However, I have not found the ideal constants to use for these terms and assume someone else will continue this work in the future. • Apparatus • The hardware used for this project is a small fan, a TIP 120 transistor, and a National Instruments DAQ. • Voltage from a battery is fed into the fan, which is then connected to the transistor from its ground side. The transistor is then connected to the ground side of the battery. • The photo resistor is plugged into a DAQ input channel for measuring voltage. • A DAQ output port is plugged into the transistor's base. It is programmed using LabView 7. Theory The proportional term gives back the difference between the set voltage and actual voltage. When the integral term is added, it moves the actual voltage to the set voltage.. When the derivate term is added, it settles the actual voltage near the set voltage. Figure 5 – Fan controlling amount of light reflected off of photo-resistor by blowing at a black piece of paper When their numerical counterparts replace the integral and derivative terms you get. Figure 6 – Plots showing behavior of different control loops. (a) Proportional loop: fluctuates heavily. (b) PI loop: oscillates around set point. (c) PID loop: stays flat on set point. Figure 2 – Schematic of the closed loop control system. With this information it is possible to design a PID closed loop control system for any application. (a) (a) (b) Figure 3 – (a) PID setup includes a fan (bottom left) with photo-resistor (top left) and transistor (top right). (b) National Instruments DAQ, used for getting/setting analog voltages. (a) (b) (c) Outcome I learned how a PID control algorithm works and will use this information during my studies in graduate school. I would also like to give a special thanks to Dale Smith, who helped me get the transistor to work for this project. References Essick, John. Hands On Introduction to LabVIEW for Scientists and Engineers. New York: Oxford University Press, 2008 (b) Figure 1 – (a) A plot of a Proportional only loop with set voltage at 10 volts. (b) A plot of a Proportional and Derivate loop that settles near 5 volts. Figure 4 – A plot of a Proportional, Derivate, and Integral loop in terms that moves towards and settles near 10 volts.