Download
1 / 55
580 likes | 796 Views
SOUTH AFRICAN PIPED-GAS INDUSTRY. PCE Briefing, 9 September 2014. Gas industry overview, regulation, and challenges Presenters: Phindile Baleni, CEO Nomfundo Maseti, Regulator Member Piped Gas Regulation. Content. Introduction Gas Policy/regulatory framework Regulatory mandate ito Gas Act

E N D
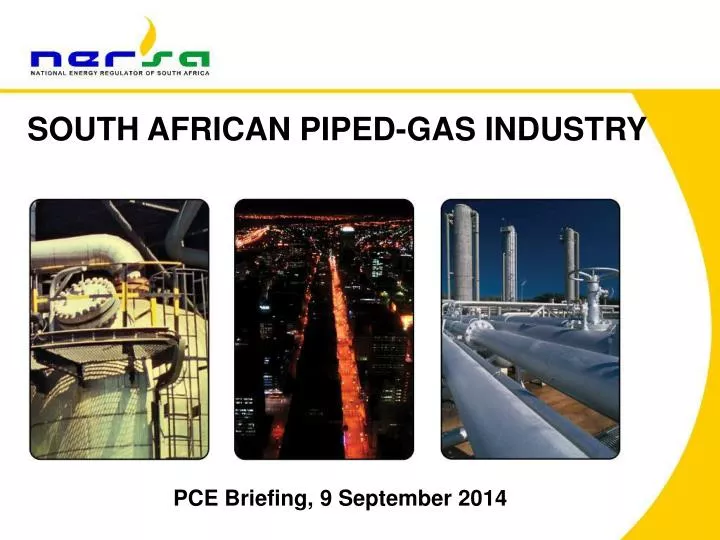
SOUTH AFRICAN PIPED-GAS INDUSTRY PCE Briefing, 9 September 2014
Gas industry overview, regulation, and challengesPresenters:Phindile Baleni, CEONomfundo Maseti, Regulator Member Piped Gas Regulation
Content • Introduction • Gas Policy/regulatory framework • Regulatory mandate ito Gas Act • Gas value chain • SA gas market structure • Current gas infrastructure • Gas trading and market opportunities • Challenges with the current landscape Gas industry overview Challenges • Industry challenges • Policy/ Regulatory challenges • Regulatory tools • Measures for introducing competition • Regulation of gas prices and tariffs • Gas Prices methodology • Tariffs guidelines • Future of gas prices • Key outcomes from public participation process on gas pricing NERSA initiatives Conclusion 3
ACRONYMS AND ABBREVIATIONS Bcm Billion cubic meters CNG Compressed natural gas DoE Department of Energy FS Free State Province GP Gauteng Province GUMP Gas Utilisation Master Plan IEP Integrated Energy Plan IRP Integrated Resource Plan JHB Johannesburg LNG Liquefied natural gas LPG Liquefied Petroleum Gas MGJ/a Million Gigajoules per annum MP Mpumalanga Province NG Natural Gas NGV Natural Gas Vehicle NDPNational Development Plan NERSA National Energy Regulator of South Africa TCF Trillion cubic feet 4
INTRODUCTION • The National Energy Regulator of South Africa (NERSA), a Schedule 3A Public Finance Management Act, 1999 (Act No. 1 of 1999) Public Entity was established on 1 October 2005 in terms of the National Energy Regulator Act, 2004 (Act No. 40 of 2004) to regulate: • Electricity industry (Electricity Regulation Act, 2006 (Act No. 4 of 2006)) • Piped-Gas industry (Gas Act, 2001 (Act No. 48 of 2001)) • Petroleum Pipelines industry (Petroleum Pipelines Act, 2003 (Act No. 60 of 2003)) 5
OVERALL MANDATE NERSA’s mandate is anchored in: • 4 Primary Acts: • National Energy Regulator Act, 2004 (Act No. 40 of 2004) • Electricity Regulation Act, 2006 (Act No. 4 of 2006) • Gas Act, 2001 (Act No. 48 of 2001) • Petroleum Pipelines Act, 2003 (Act No. 60 of 2003) • 3 Levies Acts: • Gas Regulator Levies Act, 2002 (Act No. 75 of 2002) • Petroleum Pipelines Levies Act, 2004 (Act No. 28 of 2004) • Section 5B of the Electricity Act, 1987 (Act No. 41 of 1987) 6
GAS POLICY/REGULATORY FRAMEWORK • Other impacting plans/policy documents • Gas Utilisation Master Plan* • Integrated Energy Plan* • Integrated Resource Plan 2010-2030 • National Development Plan 2012 * Currently under development 7
GAS POLICY/REGULATORY FRAMEWORK cont. • White Paper in Energy Policy (WPEP) • Promotes fuel diversification in the SA energy mix, and recognises natural gas as an attractive option for SA • WPEP also provides the basis for the development of the National Integrated Energy Plan (IEP) • National Energy Act, 2008 • National Energy Act seeks to ensure that diverse energy resources are available, in sustainable quantities and at affordable prices, to the South African economy in support of economic growth and poverty alleviation • The IEP • Its purpose and objectives are anchored in the National Energy Act • The IEP provides a roadmap of the future energy landscape for SA which guides future energy infrastructure investments and policy development
GAS POLICY FRAMEWORK cont. • Integrated Resource Plan (IRP) • provides a national electricity plan until 2030 including preferred generation technologies and timelines • Gas is allocated 3126 MW of base load and/or mid-merit CCGT generation capacity between 2019 and 2025 • 1659MW CCGT capacity to be added later in the IRP period, 2028-2030 • Gas Utilisation Master Plan (infrastructure framework) • will assess the bottlenecks and capacity constraints of existing gas infrastructure; and • plans for further gas infrastructure development particularly to enable gas to power development • The National Development Plan (NDP) • NDPrecognizes gas an alternative to move SA into a low carbon intense economy
REGULATORY Mandate ITO the GAS ACT • Regulatory mandate in a nutshell • Objectives of the Gas Act include: • Promote orderly development of the gas industry • Development of a competitive gas market; Facilitate investment; Promote competition • Functions include: • Licensing gas infrastructure • Pricing and tariffs • Compliance monitoring and enforcement • Investigations and dispute resolution • Facilitation of investment, entry and promoting industry growth through • Licensing of new gas infrastructure; and trading activities • Approval and monitoring of maximum prices and transportation tariffs • Reflective of costs, risks and economic value of the product • Enforcement of third party access to existing infrastructure 10
Scope of regulation How did we regulate until 25 March 2014? Regulated ito of the Sasol Regulatory Agreement & Gas Act The Agreement provided regulatory framework in the absence of the Gas Act (which was only enacted in 2001, and became effective in 2005) The Agreement took precedence over the Gas Act for the duration of the 10 year dispensation period
Scope of regulation • NERSA regulates the piped-gas industry • Natural/synthetic/compressed gas transported via pipeline • Scope of regulation • Currently all hydrocarbon gases transported by pipeline • Regulated activities include the construction/operation/conversion of gas facilities; and trading in gas • Excludes gas production, reticulation and LPG prices • Gas Exploration and Production falls under PASA (Petroleum Agency of South Africa) • Reticulation is a responsibility of Local Government. NERSA only monitors gas prices charged to reticulators by Sasol Gas Ltd • LPG infrastructure is licensed by NERSA but prices are regulated by DoE • Note fragmentation in the regulatory landscape 12
SA Gas market structure Upstream Midstream Downstream Reticulation - Regulated by Munics Mozambique Exploration & Production by Sasol Petroleum International Transmission ROMPCO Sasol Gas Transnet Distribution Sasol Gas NG Importation Sasol Gas Trading Pipeline gas: Sasol Gas Spring Lights Reatile • Competition may not be levelled • Sasol Gas has a competitive advantage: • as a single supplier of gas/ gas distributor • Price advantage exhibited over other traders CNG: VGN Novo Energy NGV Gas Domestic Syn gas production by Sasol Synfuels • Competitive price advantage for CNG as a vehicle fuel over petrol • Always priced approx. 20-30% below petrol price • Potential for NGV growth due to • increasing policy drives to address environmental concerns (carbon tax) • increasing appetite for cleaner transport fuels (e.g., Municipalities) • increasing appetite for cheaper fuel (Taxi Industry) PASA regulated Exploration & Production - On & offshore NERSA regulated activities
CURRENT GAS INFRASTRUCTURE Egoli Gas reticulation network in the Johannesburg area Sasol Gas Pipelines CNG mobile storage and transportation system ROMPCO Mozambique to Secunda Pipeline CNG high pressure cylinders Transnet Lilly Pipeline
Pipeline infrastructure (transmission, distribution & reticulation) • ± 1100 km transmission pipeline network owned and operated by Sasol Gas • a 865 km transmission pipeline from Mozambique to Secunda owned by ROMPCO • a 573 km transmission pipeline owned by Transnet • ± 100 km pipeline owned by PetroSA for the transmission of gas for own use • a 317 km distribution pipeline network owned and operated by Sasol Gas • ±1100 km gas reticulation network owned by Egoli Gas and regulated by City of Joburg ito Municipal bylaws • ± 58 km of gas reticulation network owned by Easigas in PE (not regulated ito Gas Act) • NERSA regulates about 70% of the existing pipeline infrastructure • CNG Infrastructure • CNG vehicle refuelling stations owned and operated by Novo Energy and NGV Gas • CNG mobile storage facilities owned and operated by Novo Energy and Virtual Gas Network
GAS TRADING • SA currently have six licensed gas traders • Sasol Gas, Spring Light Gas and Reatile supplying gas via traditional pipelines • Novo Energy, NGV Gas and Virtual Gas Network supplying gas via CNG mobile gas storage and transportation system (aka ‘Virtual Pipelines’) • Gas customers • Sasol Gas directly supplies NG and MRG to approx. 370 customers in MP, FS, GP and KZN • Spring Lights Gas on-sells MRG to about 23 customers in KZN • Reatile has not yet started operating but intends to supply gas in GP and KZN • Novo Energy and NGV Gas supply CNG as a vehicle fuel in Gauteng (669 vehicles converted, mostly taxis) • Virtual Gas Network supplies CNG to 4 industrial customers in Gauteng • Economic sectors serviced • Gas is largely consumed for industrial, commercial, domestic, transport and for power generation purposes
Immediate demand for gas • Opportunities for gas in SA exist in power generation, transport, and GTL and residential markets • Gas can serve as an efficient alternative for diesel and coal • Power generation • Opportunities for greenfield power (IPPs) also exist (various companies including Sasol, Gigajoule looking at importing gas from Mozambique mainly for baseload power generation) • Gas have benefits over nuclear and coal ito capital costs, carbon footprint, construction lead times and energy efficiency • Coal may be a cheaper option than gas for generating electricity in SA but gas has an advantage on other policy interventions to improve energy efficiency and to address environmental concerns • Overall, there is an interdependence between electricity and gas that can be exploited for the benefit of both industries
Immediate demand for gas • Gas for transport • Gas is a substitute for conventional transport fuels • CNG is an alternative for petrol & diesel for normal vehicles (about 17.7 million NGVs exist worldwide) • LNG emerging as an alternative marine fuel, likely to displace bunker fuel oil in the long-run • CNG market in SA is emergent, 4 CNG refuelling stations in Gauteng (2 operational) • Existing opportunities for market growth • Taxis, buses and commercial vehicles whose owners are looking for cheaper alternatives to petrol • Municipal and Government fleets and heavy duty vehicles driven by the need for greener transportation • CNG has economic benefits – always priced 20-30% below prevailing petrol price • CNG market could serve as an access point to the industry for greenfield traders • Growth prospects for SA CNG market could be impeded by the many developmental challenges facing the domestic industry (to be discussed later) • IDCs green transport initiative is a positive step towards the right direction, however robust policy shifts are required to create a conducive environment for this market to grow. • Gas for GTL • PetroSA is looking for more gas to enhance supplies for its GTL operations
INDUSTRY CHALLENGES…most likely to have hampered further market development • Limited domestic gas reserves which result on • Limited access to gas supply • Least development of gas infrastructure (gas infrastructure available in only four provinces, mostly concentrated in Gauteng) Proposed solution • Enhance mid-term supply through • additional pipeline imports from Mozambique and other neighboring producing countries • CNG and/or LNG imports from regional and international markets • Fast-track development of appropriate regulatory framework to enable shale gas as a long-term supply solution 19
INDUSTRY CHALLENGES cont. • Lack of anchor customer(s) to justify the: • development of domestic gas fields (e.g., Ibhubesi gas, coal bed methane) • development of major gas infrastructure to support domestic gas production or for imports • Hurdles to gas infrastructure development • Potential creditworthy off-taker(s) have been unwilling to commit • Difficulties in securing finance for large gas projects • Lack of gas infrastructure planning • Proposed solution: • Strategic partnerships required to develop necessary gas infrastructure • Eskom/IPPs through the IRP to anchor the development as a key customer • Government to facilitate and coordinate this development • Relevant government departments and agencies to be coordinated to work in synergy 20
INDUSTRY CHALLENGES cont. • Positive changes: • Revised IRP2010 allocates about 3125 MW of gas generated electricity by 2025 (3600 MW by 2028) • IRP update includes ‘big gas scenario’ in the view of domestic potential shale gas exploration • ESKOM as a potential anchor customer extensively looking at gas as an alternative fuel source • DoE currently working on the Gas Utilisation Master Plan but delays in finalizing the plan sends incorrect market signals 21
INDUSTRY CHALLENGES cont. • Difficulty in securing finance for gas projects • Significant upfront capital required for infrastructure development • Finance could come from the fiscus, public enterprises, development finance institutions, equity investment • Government has limited resources for competing priorities • No framework of incentives/subsidies to encourage investment in gas infrastructure projects • Proposed solutions • Strategic partnership between private entities and government • Entities (e.g. PetroSA, Eskom, etc) to make the project more bankable • Incentives such as accelerated depreciation allowance on energy projects that make use of gas as an energy source to generate electricity (as it was done for wind and renewable energy projects) 22
POLICY/REGULATORY CHALLENGES • Regulatory issues • Light-handed regulatory approach (Approval vs. setting of tariffs and prices • Weak enforcement mandate (can only issue notices) • Solution: Gas Act currently being amended by DoE • Policy issues • Bottom-up approach on Integrated Energy Planning – GUMP not finalised, but draft IEP already shows no significant role for gas in the energy mix • Lack of coordination by various government departments lead to misalignment of legislation regulating gas • Lack of policy drive on the increased use of natural gas in core economic sectors (Electricity industry and transport sector) • Solution: Continuous engagement between government, parliament and the industry on policy issues affecting gas industry
NERSA INITIATIVES & INTERVENTIONS • NERSA mainly regulates for market development and competition as per the objects of the Gas Act • NERSA strives to facilitate investment, entry and to promote industry growth through • Licensing of new gas infrastructure; and trading activities • Approval and monitoring of maximum prices and transportation tariffs • Reflective of costs, risks and economic value of the product • Enforcement of third party access to existing infrastructure • NERSA has developed • Gas Act Rules, 2009 – to provide for a clear and transparent licensing process • Pro-investment methodologies for approving/setting maximum price for gas and gas transportation tariffs • Rules for registration of gas production operations including small biogas operations in rural areas • Compliance framework for inspection and audits of licensees activities • Dispute resolution framework for, amongst others, investigations of complaints 24
How do we ensure fair access to gas? • According to Sasol supply is constrained to satisfy gas demand • No mandate to determine allocation of gas to the market • Single supplier currently gets preferential access to the gas (>50% of imported gas for internal use by other Sasol subsidiaries) • Existing capacity constraints an obstacle to bring more gas from Moz to SA • Measures for introducing competition within the current constraints • enforcement of third party access to existing pipelines • Development of Guidelines for TPA in transmission facilities (by licensees) • Guidelines governs the access arrangements between the transmission licensee and third parties seeking access to the licensed gas transmission pipelines • NERSA study for the determination of uncommitted capacity to gas facilities • Purpose of the study is to determine the levels of uncommitted capacity in all licensed transmission pipelines • Study not yet completed • Enforcement of ‘eligible customers’ provisions in the Regulations • Customers consuming at least 40 000 MGJ/a of gas within an exclusive licensed distribution area have a legal right to source gas from other suppliersoutside that area • Traders can compete with distributors for prospective eligible customers within those exclusive areas 25
Regulation of gas prices and tariffs • Mandate on prices and tariffs • S4(h) ‘monitor and approve and if necessary regulate tariffs for transmission and storage’ • Tariff Guidelines approved in 2009 • S21(1)(p) ‘approve maximum prices for all classes of customers’ where there is inadequate competition in terms of the Competition Act • Regulation 3(a), The Regulator must, when approving the maximum prices, be objective i.e. based on a systematic methodology applicable on a consistent and comparable basis • Maximum prices methodology approved in 2011 • The Gas Act makes a distinction between tariffand price • Price = charge for gas molecule, “Gas Energy price” • Tariff = charge for (network) service 26
The Energy Regulator does NOT ‘set’ gas prices • Distinction must be drawn between maximum and actual prices • The Energy Regulator approves maximum prices to be charged by licensees in line with sec 21(1)(p) • Why do we need to determine a value for gas? • No market (gas exchange) in South Africa • International gas prices not necessarily relevant to South Africa • Lack of competition means that the current prices are not reflective of competitive market outcomes 27
Methodology for approving maximum prices for gas (for gas molecule only) • The Methodology provides for two approaches. (1) Use of Energy Price Indicators to determine the gas energy (GE) price • This is the price of the gas energy at the point of its first entry into the transmission / distribution system • Energy price indicators used are coal, Diesel, Electricity, HFO and LPG. (2) Pass- through (or cost-build up) to cater for - • new entrants. e.g., importers of LNG, developers of domestic gas sources, etc • transition for incumbents and traders along the value chain after gas’ first entry into the transmission, distribution system • Where licensees deems the price to be materially lower than its preferred gas price 28
The methodology also provides for: • Long-term contracts, as well as shorter review periods, at the election of the licensee • Specified data sources, as well as allowance for licensees to propose other data sources for NERSA considerations • Review • Maximum Gas Energy Price • In the absence of a transparent gas market price in South Africa .. • …the maximum price for gas energy will be determined by reference to energy price indicators • This is the price of the gas energy at the point of its first entry into the transmission / distr. system • Based on specific energy price indicators (after consultation) • Coal, Diesel, Electricity, HFO, LPG 29
Use of Energy Price Indicators Approach • Maximum price of Gas Energy formula where: CL = Coal DE = Diesel EL = Electricity HFO = Heavy Fuel Oil LPG = Liquefied Petroleum Gas; and w1-w5 = weights for coal, diesel, electricity, HFO, LPG GE = w1 CL + w2 DE + w3 EL + w4HFO + w5 LPG 30
Variables, weights and sources • The outcome of the formula depends on the weights attached to the energy indicator prices • e.g. If GE is 90% determined by the coal price, the price of gas energy will be relatively low, and • if 90% LPG related, the price of GE will be relatively high • Weights were determined based on data • from an independent source (DoE) and • On facts (share of each indicator in secondary energy consumption in SA economy) 31
Pass-through approach • The pass-through approach requires a cost-based price build-up, • Costs include :- • the cost of the procured or produced gas, • any transportation or re-gasification costs • transmission tariffs • distribution tariffs, and • trading margin determined in accordance with this methodology 32
Total price for piped-gas Category 1 < 400 GJ/a Category 2 401-4,000 GJ/a Category 3 4001-40,000 GJ/a Category 4 40,001-400,000 GJ/a Category 5 400,001 – 4,000,000 GJ/a Category 6 > 4,000,000 GJ/a Trading margin Margin (R) This price must be translated to prices for customer categories (ito Regulations) Distribution Tariff (U) Transmission Tariff (R) Gas Energy Price Price (R) 33
Total price for piped-gas This methodology refers to Trading margin Margin (R) Distribution Tariff (U) Transmission Tariff (R) Maximum price for Gas Energy Price (R) 34
Maximum Prices approved to date • The Energy Regulator approved maximum prices for: • Sasol Gas – R117.69/GJ – on 26 March 2013 • Virtual Gas Network – R278/GJ - on 29 July 2013 • Novo Energy – R249/GJ - on 9 December 2013 • Spring Lights Gas – R123/GJ – on 27 February 2014 • Reatile Gastrade – applied but application not yet approved • For Sasol Gas, the Energy Regulator also approved transmission tariffs 35
Guidelines for monitoring and approving piped gas transmission and storage tariffs • Key provisions in the Guidelines:- • Licensee choose a preferred methodology from the menu of six provided in the Guidelines • Licensee can also use its own, (not in the menu), methodology so long as it is ‘proven and tested’ • Data sources are specified by NERSA • NERSA tests the application using same methodology used by the licensee in its tariff application • The menu of six methodologies provided for in the Guidelines are: • Rate of return regulation; • Incentive regulation: • Price Caps; • Revenue Caps; • Hybrids of the abovementioned approaches; • Profit sharing or sliding scales; and • Tariffs based on a discounted cash flow model of allowable revenue. 36
Each of the regulatory methodologies considered in the above menu requires the calculation of an allowed revenue formula. This formula takes the form shown below: AR = (RAB x WACC) + E + T + D +/- C Where AR is allowed revenue for a distinct regulatory period RAB is the Regulatory Asset Base WACCis the effective weighted average cost of capital E is Expenses: maintenance and operating expenses in the tariff period under review T is Tax: flow-though tax expense in the tariff period under review D is Depreciation: the charge for the tariff period under review C is the claw-back based on actual volumes lagged by one year • All prudently and efficiently incurred expenses go as a pass through • Companies are allowed to make a return commensurate with risk. • The return for each company is determined using its Weighted Average Cost of Capital (WACC) • The WACC (expressed as a %) is applied to the sum of the working capital, asset base and/or cost of sales • The cost of equity is determined using CAPM 37
Approved Transmission Tariffs Sasol Gas Transnet Pipelines 38
ROMPCO 39
Conclusions about methodology Important to note that A regulated price can only mimic competitive outcomes, real pressure on prices will only come from gas-on-gas competition the Gas Act provides for a complex pricing and tariffs regime: NERSA ‘approve’ maximum prices for gas NERSA ‘monitor and approve’ transmission and storage tariffs Regulations: must allow an efficient operator to recover its prudently incurred costs and make a profit commensurate with risk NERSA must use an approach that is objective, systematic, fair, non-discriminatory, transparent, predictable and efficient 40
Balancing the interests Attempt to provide a flexible framework that provides for all eventualities and all players Is a balanced approach with some compromises - expect to perfect methodology over time Safeguards built in Pass through approach Difficult to please everyone, all of the time Energy Regulator has opted for best option available balancing the interests of consumers, suppliers and potential entrants 41
NERSA is currently not in a position to forecast gas prices going forward Gas prices were regulated ito of the Sasol Agreement for the past 10 years Implementation of maximum prices for gas only started in 2014 Impact assessment of the pricing could only be conducted over a period of time However, gas prices are likely to be affected by the other Energy Indicators (Coal, LPG, diesel, Electricity & HFO) as discussed above Competition in the market will drive gas prices in the long-term How does the Gas Energy price compare with international gas prices? The future of gas prices in sa 42
South Africa class 3 price in Gauteng as at March 2013 (4,001GJ – 40,000GJ per annum, including Sasol tariffs) compared to EU industrial tariffs (10,000GJ – 100,000GJ per annum) (ZAR / GJ)* Source: Eurostat * Exchange rates: 2011: R10.06/EUR; 2012: R10.50/EUR; 2013: R12.79/EUR (Average exchange rates per year. Source: Oanda.com) 43
Source: waterborne Energy, Inc. Data in $US/MMbtu LNG prices before the regas cost South Africa GE = $12 Price of gas in its gaseous form compared to LNG • According to stakeholders looking at LNG as a supply option - • LNG landed price plus regas costs in SA is expected to be $16 /Mmbtu • This price compares well with landed prices of LNG in other regions 44
Average fuel prices for FY15 R/GJ 79 Coal Diesel LPG Electricity HFO Gas Prices for alternative fuels based on Group assumptions, save for coal where McCloskey forecast was used Average electricity price in FY15: R0.72/kWh or R193/GJ. Sasol Gas customers who pay the highest possible price and tariff, still has a total charge equivalent to R0.51/KWh – less than the average electricity price. Source: Sasol Gas 45
NERSA has no mandate for Dx tariffs & margins Prices will be too low – Sasol, traders + potential suppliers Prices will be too high (monopolistic prices) – current customers Prices will not reflect market prices – Sasol, customers and some (potential) suppliers Traders will be disadvantaged by a ‘pancaking approach’ as the market has a ceiling (trader) Choice of alternatives – broad agreement with stakeholders Weights of the energy price indicators in the basket – criticism:- Traders and Sasol prefer higher weighting of higher priced indicators i.e. LPG and HFO Consumers prefer higher weighting lower priced indicators i.e. coal Data sources – DoE not preferred for weights data or HFO price Cost-plus approach more preferred by most users Key outcomes from public participation process on gas pricing 46
Will prices be too high? Risk of prices that are too high: Windfall profits No customers willing to switch / no viable gas business NO, because GE price approximates value at which customers would be willing to switch to gas (compared to other energy carriers) Is based on ‘wholesale’ prices of alternatives Provides a maximum below which can discount 47
Will prices be too low? Risk of prices that are too low: No viable gas business / No entry Rapid depletion of finite gas resources NO, because GE price higher than minimum landed price (S) GE is constructed based on comparable prices of alternatives, to which all other costs are added All costs associated with transportation added / passed on via tariffs (profit) Margin for traders is added to cover all costs and profit for the selling of gas 48
How Sasol Implemented Max Prices • FY15 forecast • 40 001 – 400 000 GJ = 74 customers , 10mGJ • 400 0001 – 4m GJ = 25 customers , 35mGJ Source: Sasol Gas 49
Notable Impact: Of the 20 customers that consume 80% of external volumes, 25% will see price decreases Source: Sasol Gas 50