Download
1 / 24
260 likes | 396 Views
Spectroscopic Interpretation NMR. Dr. Richard W. McCabe Department of Forensic and Investigative Science M57 rwmccabe@uclan.ac.uk. Spectroscopy.

E N D
Spectroscopic InterpretationNMR Dr. Richard W. McCabe Department of Forensic and Investigative Science M57 rwmccabe@uclan.ac.uk
Spectroscopy • Spectroscopy is concerned with the absorption of light of specific wavelengths or frequencies by molecules (e.g. in the visible, ultra violet, infra red, radio frequency and other ranges). • The pattern of absorption versus frequency gives us a spectrum which can tell us a great deal about the structure of the molecule.
Common Types of Spectroscopy N.B. Mass Spectrometry is not strictly a Spectroscopy!
Nuclear Magnetic Resonance Spectroscopy • One of the most powerful techniques for helping determine the structure of a molecule. • As the name suggests, the nuclei absorb light of the correct energy (in the radio frequency range, MHz) when they are placed in a magnetic field. • The NMR effect is now used in the modern magnetic resonance body scanners which form their image by looking at the variation of the concentration of water, (or other hydrogen-containing molecules), through a “slice” of tissue - consecutive “slices” are built-up to give a 3D-image of the inside of a body.
Information from an NMR Spectrum • Major structural information can be derived from the following: 1. CHEMICAL SHIFT, d, gives information about the ELECTRONIC environment of an atom; i.e. hybridisation, electronic effects (Inductive and Resonance), through space magnetic effects, etc. 2. With some nuclei quantitation, INTEGRAL. 3. Nuclear magnets interact (COUPLING) and give information about the number of adjacent nmr active nuclei, MULTIPLICITIES. This in turn can also give stereochemical information.
Origin of the NMR Effect 1 • Certain nuclei (isotopes) have a property called spin. (N.B. Only 2 or 3 elements do not have a spin (NMR) active isotope.) • Nuclear spin arises from unpaired nucleons (protons or neutrons) in nuclear energy levels - nucleons spin-pair in an analogous manner to electrons in electronic energy levels! Examples of nuclear spins (spin quantum number is 1/2) include: • spin 0 : 4He, 12C, 16O (no spin - so no NMR) • spin 1/2 : 1H, 3H, 13C, 15N, 19F, 31P (spin - so NMR) • spin 1 : 2H, 14N (spin - so NMR) • spin 3/2 , etc : 79Br (spin - so NMR) - and many more!
Origin of the NMR Effect 2 • A spinning (moving) particle (in this case a nucleus) generates a magnetic field: consider the magnetic field generated when an electric current flows in a wire! • If the spinning particle is placed in a large magnetic field the “nuclear magnet” will line up with the external magnetic field. • When the nucleus is given energy, i.e. in the form of a radio beam of the correct frequency, then the direction of the nuclear magnetic field can be forced to point in the opposite direction. This absorption of light gives the NMR spectrum. N.B. Each isotope has its own individual frequency range (MHz).
Simplified Diagram of an NMR Spectrometer • An NMR spectrometer needs a strong, uniform magnetic field and usually uses a cryomagnet. Tube Spins Bo N S Receiver Coil to Detector Transmitter Coil Gives Rf Pulse
Chemical Shifts, d • The “frequency” scale in NMR is expressed as the difference in parts per million that the nucleus resonates from the frequency (n) that the nuclei of a reference nucleus resonate in the particular magnetic field used. i.e. d = (n of nucleus - n of standard) Hz ppm spectrometer frequency in MHz • Different chemical environments in a molecule produce peaks at different frequencies - Thus the name chemical shift!!
Symmetry and Chemical Shift • Quite often we see less peaks than the number of carbons in a molecule. • Carbons that are identical by symmetry have the same chemical shift and so the only indication that we have identical carbons is that the peaks are sometimes larger. • Example:
13C NMR Chemical Shifts • Typically the ranges of 13C NMR d values can be divided into “80 ppm’s”: • alkanes ca. d 0 to d 80 ppm • alkenes/aromatics ca. d 80 to d 160 ppm • carbonyls ca. d 160 to d 240 ppm • N.B. 1. d CH3 < d CH2 < d CH < d C • N.B. 2. d Aromatics > d Alkene - see ring current effects later.
13C NMR Spectra of Alkenes, Alkynes and Aromatics 1 • Typically resonances for unsaturated Carbon atoms come at higher chemical shift values (d) than alkanes, i.e.: • Aromatics > Alkenes > Alkynes > Alkanes • N.B. Each p-system creates a small magnetic field which adds to the external field and so increases d. • N.B. d alkynes lower than expected as the sp orbital extends past, and shields, the C atoms of the CC. d 160 ppm d 80 ppm d 0 ppm
13C NMR Spectra of Carbonyl Compounds • The chemical shift values for C=O carbons occur in the range d 160-240 ppm. Their exact position depends upon a combination of Inductive and Resonance effects: • Inductive effects give d >200 ppm: MCO > COCl ~ (CO)2O > HCO > RCO • Resonance effects give d < 200 ppm: C=CCO > ArCO > OCO > NCO • N.B these effects parallel the reactivity and IR frequency of the C=O group.
Shielding and Deshielding in NMR Spectra 1 • Different nuclei give different chemical shifts because electrons in bonds also produce their own magnetic field which opposes the external magnetic field, SHIELDS the nucleus from the external magnetic field and thus affects the radio frequency needed for resonance. Lines of Force Shielding at Nucleus Nucleus Electrons
Shielding and Deshielding in NMR Spectra 2 • If electronic effects in the molecule (i.e. hybridisation, inductive or resonance effects) pull electron density away from the region of the nucleus the chemical shift, d, increases and the nucleus is said to be DESHIELDED. • If the electronic effects push electron density into the region of the nucleus, d, decreases and the nucleus is SHIELDED • N.B. >d+ increases deshielding and gives >d ppm!! (i.e. all d’s!!!)
Factors Governing Chemical Shifts, (a) Hybridisation • Alkanes - four carbon sp3 orbitals around the carbon nucleus form a “sphere” of electron density. This shields the C nucleus quite effectively - \ low dC (0-80 ppm) values. • Alkenes - the carbon sp2 hybrid orbitals form a plane - “exposing” the nucleus to the magnetic field - the p bond is quite diffuse, resides mainly between the atoms and not around the nuclei so leaving the nucleus exposed again! - \ high dC (80-160 ppm) values. • Alkynes - the carbon sp orbitals form a line, effectively “exposing” the nucleus, but the shorter triple bond “pulls” the nuclei into the “cylinder” of electron density formed by the 2 p bonds - \ lower dC (60-100 ppm) values than expected.
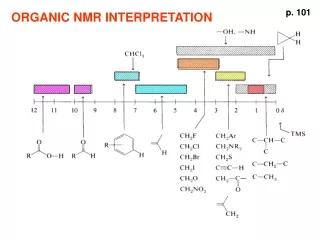
Factors Governing Chemical Shifts, (b) Electronic Effects • As the electronegativity, or d+ character, of an atom attached to a particular nucleus increases then the d value increases: H3C-Si dC & dH 0 ppm {tetramethylsilane [TMS] (H3C)4Si, used as standard, i.e. d 0 ppm, for 1H, 13C and 29Si NMR} H3C-C dC 15 ppm H3C-C=O dC 25 ppm N.B. O “far” away H3C-N dC 30 ppm H3C-Br dC 33 ppm H3C-Cl dC 35 ppm H3C-O dC 50 ppm N.B. O near - effect large! H3C-F dC 75 ppm
The number of nuclei causing a peak - Integration • (semi-)Quantitative estimates of the relative number of nuclei causing a peak can be obtained by integration (a measure of the area under the peak). This can be done automatically by the nmr computer and presented as either a numerical value or by measuring the height of an integral trace on the printout. • Integration is easy for 1H, but difficult for most other nuclei due to saturation problems. • Generally 1H integrals accurate to ca. 10% unless extreme measures taken.
Spin-Spin Coupling - Tells us how many NMR active nuclei are adjacent! • When spin-active nuclei are near to one another in a molecule their magnetic fields interact and the NMR signal is split. The general pattern for 13C-1H couplings in the 13C NMR spectrum is: • C (with no H’s!) singlet (s) - one line • CH doublet (d) - two lines • CH2 triplet (t) - three lines • CH3 quartet (q) - four lines • This can be confusing sometimes as many lines can overlap and small couplings from further nuclei can also interfere!!!
Determining the no. of H’s on a Carbon 1 - Decoupling & Off Resonance • 13C NMR spectra are usually simplified so that we see just one resonance for each different carbon. • The spin-spin splitting of the C by coupling to H can be eliminated by irradiating the H nuclei with a strong Rf beam. This removes the coupling and gives a single line for each different C (C’s which are identical by symmetry give just one line). • The above process has lost information (i.e. we no longer know the no. of H’s on the C!!!) so a second experiment can be run which brings back some of the coupling - the OFF RESONANCE spectrum - and gives narrow splitting into the q, t, d & s.
The Different Spin-Spin Coupling 13C NMR Experiments • The 13C spectrum may be obtained in each of the following ways: