Download
1 / 20
200 likes | 306 Views
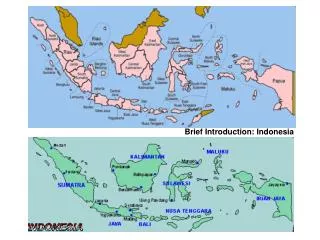
Evaluating the impacts of protected areas on ecosystem services in Indonesia: In Search of Spatial Complementarities. Daniela Miteva Brian Murray Subhrendu Pattanayak. Duke University. Should protected areas work?. Non-random location of protected areas

E N D
Evaluating the impacts of protected areas on ecosystem services in Indonesia: In Search of Spatial Complementarities Daniela Miteva Brian Murray Subhrendu Pattanayak Duke University
Should protected areas work? • Non-random location of protected areas • Tend to be established on “rock and ice” • Spillover effects • Extraction activities may be displaced to the buffer zones or other unprotected nearby areas • Different levels of protection • IUCN categories I-VI • Enforcement
How to evaluate the effectiveness of protected areas? • Methodology • Need to compare protected units with observationally similar unprotected units • This yields only an average estimate of the impact • Test for heterogeneity of the impact • Outcomes • Ecosystem structure vs. function
Previous studies (1) *Indigenous reserves and wetlands excluded
Previous studies (2) **The study selected 5 % of each country’s PA (treatment) and an area 4 times as large to serve as control
To recap: main research questions • Do the protected areas in Indonesia protect habitats and ecosystem services? • Does the impact of protected areas vary with the characteristics of the area? • Where do the tradeoffs and complementarities occur in space? This is still very much work in progress…
Data • Biophysical characteristics • Location (distance to ports by type; proximity to district capitals, mills and markets; slope, elevation, river length, urban vs. rural) • Climate (average temperature & precipitation, aridity index, organic content and pH levels of the soils) • Socio-economic (road length, number, area and type of timber concessions, population density, village accessibility) • Protected Areas (IUCN categories I-IV)
Why do we care about mangroves? • Provision of multiple ecosystem services • Blue carbon sequestration • Habitat for species • Storm protection • Very rapid loss of mangroves in Indonesia • Cut for timber • Cleared for aquaculture & agriculture Image source: http://aquaviews.net/scuba-guides/mangrove-diving/
Methodology • Propensity score matching (PSM) to identify observationally similar protected and unprotected villages • Does not rely on a specific functional form • Reduces the dimensionality of the matching • Partial Linear Models (PLM) • Sensitivity analysis & robustness checks
Methodology (cont’d): PLM • Semi-parametric regression of the form • Estimated in 2 stages • Least squares on m-th order difference to estimate • Non-parametric (loess) estimation for • Properties • Allows some variables to enter non-parametrically • Reduces the dimensionality of the problem • Consistent estimation for , but the efficiency depends on the order of differencing (m)
Results: Deforestation 2000-2005 • Protected areas do not seem to protect forests: ATT=20.91, t=0.47 • Hard to match the very high propensity scores • The impact varies R2=0.19, n=2214 *** 1%, ** 5%, *10%
The impact seems to vary non-linearly with the slope Deforestation P<0.01
Results: Mangrove loss 2000-2005 • Protected areas do not seem to protect mangrove patches, either (ATT=-0.14 , t=-0.17) • Hard to match the very high propensity scores • The impact varies R2=0.4, n=139 *** 1%, ** 5%, *10%
Impact seems to vary nonlinearly the length of the river network Mangrove loss P=0.001
Lots of caveats at present… • Very preliminary results • Have not looked at the year the PA was established • Have not considered spatial spillovers • Numerous ecosystem services still to be analyzed • Dealing with decentralization in Indonesia • Constant changes of the administrative units at all levels • Institutional drivers of change • Using geospatial data • Raster resolution introduces errors in the dependent & independent variables
Bibliography • Andam, K. S., P. J. Ferraro, et al. (2008). "Measuring the Effectiveness of Protected Area Networks in Reducing • Deforestation." Proceedings of the National Academy of Sciences 105(42): 16089‐16094. • Andam, K. S., P. J. Ferraro, et al. (2010). "Protected Areas Reduced Poverty in Costa Rica and Thailand." • Proceedings of the National Academy of Sciences 107(22): 9996‐10001. • Chape, S., J. Harrison, et al. (2005). "Measuring the Extent and Effectiveness of Protected Areas as an Indicator • for Meeting Global Biodiversity Targets." Philosophical Transactions of the Royal Society B: Biological Sciences • 360(1454): 443‐455. • Das, S. and J. R. Vincent (2009). "Mangroves protected villages and reduced death toll during Indian super cyclone." Proceedings of the National Academy of Sciences 106(18): 7357-7360. • Ferraro, P. and M. Hanauer (2011). "Protecting Ecosystems and Alleviating Poverty with Parks and Reserves: • ‘Win‐Win’ or Tradeoffs?" Environmental and Resource Economics 48(2): 269‐286. • Ferarro, P., M. Hanauer and K. Sims (Forthcoming). “Conditions associated with protected area success in • conservation and poverty alleviation”, Proceedings of the National Academy of Sciences • Ferraro, P. J. and S. K. Pattanayak (2006). "Money for Nothing? A Call for Empirical Evaluation of Biodiversity • Conservation Investments." PLoSBiol4(4): e105. • Joppa, L. and A. Pfaff (2010). "Reassessing the Forest Impacts of Protection." Annals of the New York Academy • of Sciences 1185(1): 135‐149. • Nagendra, H. (2008). "Do Parks Work? Impact of Protected Areas on Land Cover Clearing." AMBIO: A Journal • of the Human Environment 37(5): 330‐337. • Naughton‐Treves, L., M. B. Holland, et al. (2005). "The Role of Protected Areas in Conserving Biodiversity and • Sustaining Local Livelihoods." Annual Review of Environment and Resources 30(1): 219‐25
Protected areas* by category *Only the ones that have been formally designated as such; categories V and VI have also been excluded from the analysis