Download
1 / 25
290 likes | 670 Views
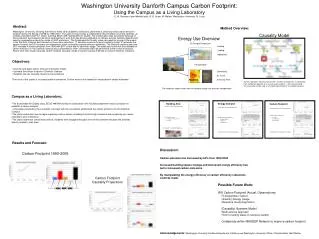
Methodologies of Carbon Estimation. By Zahabu , E & Malimbwi , R.E Department of Forest Mensuration and Management (SUA). Introduction. Carbon trade involves the sale of carbon credits. There are two main types of Carbon Trading Schemes that are operating globally to-date:

E N D
Methodologies of Carbon Estimation By Zahabu, E & Malimbwi, R.E Department of Forest Mensuration and Management (SUA)
Introduction • Carbon trade involves the sale of carbon credits. • There are two main types of Carbon Trading Schemes that are operating globally to-date: • Voluntary Carbon Trading (VCT), and • The official Kyoto Protocol Carbon Trading Mechanisms. • Carbon benefit of any forest carbon project = carbon changes to known levels of precision. • Determination of carbon changes requires baselines
Baselines • Baseline: historical trends against which additional carbon benefits as a result of carbon project can be determined. • Baseline and monitoring schemes • individual project, • regional e.g Eastern Arc, and • national levels • Requires reliable data on forest extent and stocking.
What Should be Measured? • Forest Extent • Forest Stocks in Five IPCC pools: • aboveground, • belowground, • litter, • dead wood and • soil organic carbon • Widely accepted forest inventory procedures recommended by IPCC Good Practice Guide (IPCC, 2003) • CDM Approved LULUCF methodologies.
Measurable Carbon changes • Sequestration/Enhancement • increases of forest biomass within areas of existing forest • Conservation • maintenance of a steady level of forest area and biomass density, • relate to forests that are already properly managed, e.g • protective forest reserves and • national parks • could be rewarded through a special “conservation” under REDD. • Reduction in emissions from deforestation • i.e. based on comparisons of rates of change of forest area over time, • Reductions in emissions from degradation • reductions in biomass/carbon stock in the forest without loss of forest area,
Principles of Baseline Construction • Net-net accounting: • compares emissions or removal in the commitment period to those of a reference scenario i.e historical base year (e.g. 1990) or base period (e.g. 1990-2000), • Gross-net accounting: • Measurements of change of carbon stock are compared only over the commitment period itself. • Measure stock at the beginning of the project and compares this to the future
Baseline for Deforestation • Principle: • a reference scenario from a historical period and net-net accounting. • Based on remotely sensed data over a historical period which shows change in area covered by forest. • Then data on carbon stock in different types of forest are used to calculate the change in terms of tons of carbon. • May be projected into the future and used to credit the additional mitigation benefit of the project • Challenges: • Setting reference base year • Carbon stock data highly variable: national forest inventory not undertaken • Assumes carbon stock per unit area is constant
FAO: FRA 2005 • Tanzania used satellite imagery interpreted data of: • 1984 (Millington and Towsend, 1989) and compared these with • 1995 Hunting Technical Services (1997) for the determination of land cover changes in the country. • Annual deforestation = 412,000 ha • Average stocking 36 m3/ha from CEEST, (1999) • Carbon data are reported with their statistical confidence intervals (expressed as values) at known precision level. • Most previous studies had low precision levels due to low sampling intensity adopted. • Moreover, they cover only a few forests.
Baseline for Degradation • Look at rates of biomass loss within the forest • This is not visible in remote sensing • Need ground measurements: No previous quality data • Possible to use one of the following techniques: • advanced remote sensing techniques (LiDAR), • harvesting estimates from the local people, • harvesting estimates from stumps counts, • default values (rule of thumb)/modelling, or • harvesting estimates from control sites. • Will be captured together with enhancement under gross-net accounting
Normal growth pattern Growth Degradation Present stock Protective for. Present stock Productive For Time (years) Start Measurements Forest Degradation & Enhancement Baselines • No previous data on forest degradation & enhancement • Protective forest: to determine the rate of recovery • Productive forests: to determine the rate of degradation Recover toward the threshold Baseline Degrd. Start of mgt
Establishment of Baseline at National Level • Carryout national forest inventory to establish deforestation rates and stocking levels • Determine land use cover changes for the period of 1975 to 1990 to 2000 to 2007 using Landsat TM (FAO, 2007) • Conduct case studies to quantify emission factors for different forest types • Identify drivers of deforestation • Training on national forest inventories and remote sensing • Development of tools for assessment and monitoring of deforestation • Monitoring in PSP/LiDAR technology to capture forest enhancement and/or degradation levels.
Establishment of Baselines at Projects Level • Review and synthesize existing studies on degradation/ growth rates • Development and testing of methodologies to measure and monitor enhancement and/or forest degradation • Development of tools, guidelines and manual for degradation assessment and monitoring • Carryout assessment and monitoring of forest degradation in demonstration projects for establishing historic degradation emission factors including cost implications, and accuracy level
Carbon Assessment & Monitoring by Local Communities • This is a strategy to involve local communities in order to reduce the transaction costs of measuring carbon • Local communities were trained and tasked to conduct the measurements • Techniques were developed to measure and monitor carbon stock. • They are: • User friendly to the users - i.e.to the communities • reliable and • presented in a format acceptable to the scientific community
The equipment Consists of: • A handheld computer with ArcPadTM 6.0 software and connected to GPS • It is easy to use • Is used to locate: • forestry boundaries • sample plots and • recording measurement data • With a step-by-step guide to the procedures, local communities were trained in a short time and were able to use the system effectively
Steps in Carbon Assessment • Forest mapping/stratification • Pilot survey to estimate variance and number of sample plots • Locate the sample plots on the ground • Measure the dbh of all trees • Set out the sub-plots for the grasses, herb and litter data • Take soil samples randomly within the plot
Data analysis The following trees stand parameters were computed: • Density i.e. the number of stems per ha (N) • Basal area per hectare (Dominance)(G) • Volume per ha (V) and • Dry biomass / carbon (tones per ha) • Trees volume and biomass were computed using tested local existing allometric functions for the areas. • Computation were fitted on Ms Access database
Conclusions & Recommendations • Methods exists to assess and measure forest carbon, however these are complex to the users • More studies are required for the Development of user friendly tools for the assessment and monitoring forest carbon
The End! Thank You!!! Ahsanteni Sana!!!