Download
1 / 9
90 likes | 273 Views
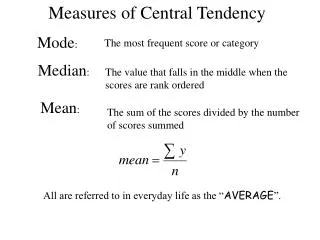
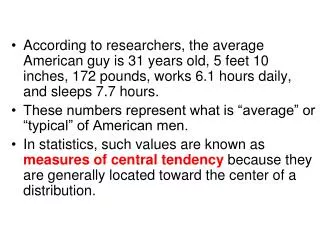
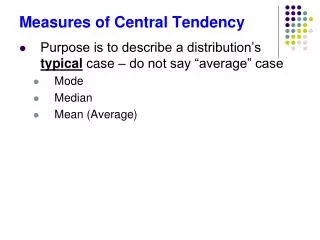
Appropriate Measures of Central Tendency. Nominal variables Mode Ordinal variables Median Interval level variables Mean - If the distribution is normal (median is better with skewed distribution). Central tendency and the shape of the distribution.

E N D
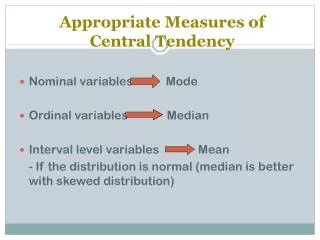
Appropriate Measures of Central Tendency • Nominal variables Mode • Ordinal variables Median • Interval level variables Mean - If the distribution is normal (median is better with skewed distribution)
Ukuran Penyebaran • Suatu data yang mempunyai kecenderungan (tendensi) pusat misalnya rata-rata yang sama belum tentu mempunyai penyebaran data yang sama pula. • Ukuran penyebaran (variasi) menyatakan seberapa jauh nilai amatan yang sebenarnya menyimpang atau berbeda dengan nilai pusatnya. • kegunaan dari ukuran variasi ini : untuk mengetahui seberapa jauh observasi melenceng dari nilai rata-ratanya.
How well does the mean represent the scores in a distribution? The logic here is to determine how much spread is in the scores. • How much do the scores "deviate" from the mean? Think of the mean as the true score or as your best guess. • If every X were very close to the Mean, the mean would be a very good predictor. • If the distribution is very sharply peaked then the mean is a good measure of central tendency and if you were to use the mean to make predictions you would be right or close much of the time.
The larger the standard deviation figure, the wider the range of distribution away from the measure of central tendency
Ukuran-Ukuran Penyebaran • Range (Jangkauan) • Merupakan selisih nilai observasi tertinggi dengan nilai observasi terendah. • Contoh
Variansi • Variansi populasi
Contoh : Tentukan variansi dari 5, 7, 2, 2, 4 ! Peny : Rata-rata =5 Variansi = 4.5