Download
1 / 12
120 likes | 262 Views
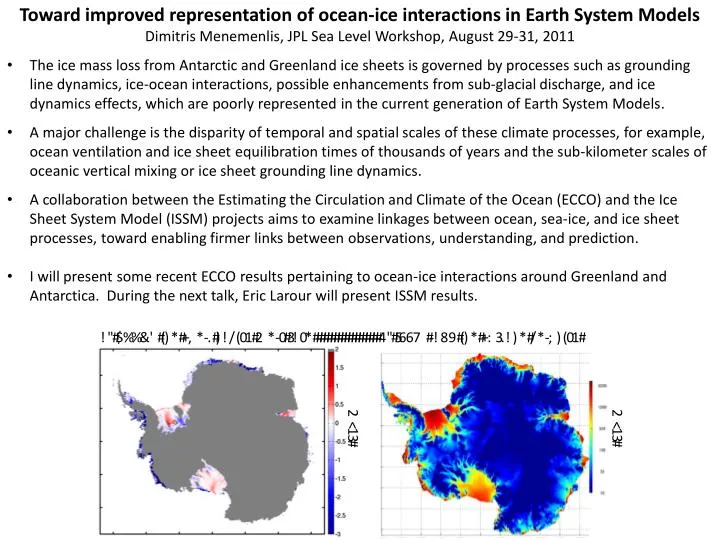
Toward improved representation of ocean-ice interactions in Earth System Models Dimitris Menemenlis, JPL Sea Level Workshop, August 29-31, 2011

E N D
Toward improved representation of ocean-ice interactions in Earth System Models • Dimitris Menemenlis, JPL Sea Level Workshop, August 29-31, 2011 • The ice mass loss from Antarctic and Greenland ice sheets is governed by processes such as grounding line dynamics, ice-ocean interactions, possible enhancements from sub-glacial discharge, and ice dynamics effects, which are poorly represented in the current generation of Earth System Models. • A major challenge is the disparity of temporal and spatial scales of these climate processes, for example, ocean ventilation and ice sheet equilibration times of thousands of years and the sub-kilometer scales of oceanic vertical mixing or ice sheet grounding line dynamics. • A collaboration between the Estimating the Circulation and Climate of the Ocean (ECCO) and the Ice Sheet System Model (ISSM) projects aims to examine linkages between ocean, sea-ice, and ice sheet processes, toward enabling firmer links between observations, understanding, and prediction. • I will present some recent ECCO results pertaining to ocean-ice interactions around Greenland and Antarctica. During the next talk, Eric Larour will present ISSM results.
Arctic ice‐ocean simulation with optimized model parameters Sea ice flux Sea ice extent Sea ice velocity Pacific water circulation, upper 200 m (1994-2004) Sea ice thickness (Nguyen et al., 2011)
Adjoint-method-based ocean and sea ice Labrador Sea and Baffin Bay optimization Dec 1993 Dec 2004 66N 66N 60N 60N (Fenty, 2010)
New sea ice constitutive model(Deborah Sulsky, UNM) Observations of sea ice kinematics (Ron Kwok and Gunnar Spreen, JPL) a) b) Russia Alaska seasonal sea ice border LKFs Canada Greenland d) c) day-1 Nov. 1997 sea ice deformation: Alaska a) b) Russia LKFs Canada Greenland d) c) Fig. 3: Example of observed (a) and modeled sea ice shear fields for Nov. 1997: b) 18km, c) 9km and d) 4km model grid spacing.
Numerical experiments on subaqueous melting of Greenland tidewater glaciers in response to ocean warming and enhanced subglacial runoff Warm water Fresh, cold sub-glacial runoff ➔ mixing & upwelling (Rignot et al., 2010) • Simulated subaqueous melting is strongly dependent on subglacial runoff: it ceases when subglacial runoff is zero and increases sub-linearly with the flux of subglacial runoff. • Subaqueous melting increases quadratically with ocean thermal forcing when subglacial runoff is low but only linearly when subglacial runoff is high. • For high runoff rates, simulated melt rates are in the range of several meters per day, consistent with limited field data. (Xu et al., submitted)
Glacier acceleration caused by spreading of warm ocean waters around Greenland 300-m temperature from an Arctic ice‐ocean simulation with optimized model parameters and melt rates sensitivities from previous slide suggests massive increases in subaqueous melting, exceeding 19km per summer in some sectors, which must have been sufficient to destabilize the glacier fronts, unground them from their shoaling position, and trigger flow acceleration. (Rignot et al., submitted)
Observed SST, ECCO2 300-m temperature, and GRACE ice mass loss in Greenland SST Time-variable gravity data from GRACE indicates that mass loss from Greenland Ice Sheet has undergone a clockwise migration during last decade, starting from a high loss in southeast, propagating to southwest and northwest, and subsequently decreasing in the southeast while still increasing in the northwest. This study examines how this time evolution relates to observed SST and ECCO2 300-m temperature around Greenland. This evolution patterns of SST and 300-m temperature are strikingly similar to the evolution of GRACE-derived ice sheet mass loss. 300-m (Velicognaet al., submitted)
Southern Ocean, sea ice, and ice-shelf cavity optimization Théo Touvet, Michael Schodlok, and Hong Zhang Sea level change A Green’s function approach is being used to optimize model parameters in an eddying Southern Ocean, sea ice, and ice shelf cavity configuration of the Massachusetts Institute of Technology general circulation model (MITgcm). Figures to left display sensitivity of model solution to freshwater input around Antarctica. Too much freshwater increase sea level around Antarctica and slows down the Drake Passage transport. Too little runoff causes wintertime polynyas (not shown). Drake Passage Transport
Modeling ice shelf-ocean interactions Michael Schodlok ECCO2 estimates of basal melting Freshwater flux (59 mSv or 1600 Gt/a) is double previous (BRIOS) estimates, more consistent with mass loss derived from ICESat/GLAS data (55 mSv), comparable in size with iceberg calving (2000 Gt/a). Antarctic Bottom Water formation Freshwater input from basal melt decreases High Salinity Shelf Water production, which affects Antarctic Bottom Water production and meridional overturning. Coupling with ISSM Experimental coupling with JPL/UCI ISSM is underway for improved estimates of ice shelf-ocean boundary conditions.
Sensitivity of the ice shelf ocean system to the sub-ice shelf cavity shape measured by NASA IceBridge in Pine Island Glacier, West Antarctica Pine Island Bay IceBridge data reveal the existence of a trough from the ice shelf edge to the grounding line, enabling warm Circumpolar Deep Water to penetrate to the grounding line, hence leading to higher melt rates. The mean melt rate for the IceBridge experiment is 28 m/a, much higher than previous model estimates but closer to estimates from satellite data. Total melt rate is ∼7 m/a higher for IceBridge bathymetry than for BEDMAP but temporal evolution remains unchanged, indicating that temporal melting variability is mostly driven by processes outside the cavity. Cavity bathymetry of Pine Island derived from BEDMAP (left) and from IceBridge data (right). (Schodlok et al., submitted)
Adjoint sensitivities of sub-ice shelf melt rates to ocean circulation under Pine Island Ice Shelf, West Antarctica Heimbach and Losch have developed an adjoint model for the MITgcm ice shelf cavity model. As a first demonstration of this new capability, they investigated the sensitivity of sub-ice shelf melt rates to changes in the oceanic state. The inferred sensitivities reveal a dominant time scale of roughly 60 days over which the shelf exit is connected to the deep interior. To the extent that these transient patterns are robust they carry important information for decision-making in observation deployment and monitoring. (Heimbach and Losch, submitted)
Summary and Concluding Remarks • The interaction between ocean and ice sheets on rather small scales, that is, in sub-ice shelf cavities around Antarctica and in narrow fjords around Greenland, may provide a key link between observed accelerated glacier flow and large scale oceanic variability and circulation changes. • Critical processes on the oceanic side include topographic steering, eddy variability, tidal mixing, and brine rejection by sea ice. • For ice sheets (discussed next by Eric Larour), critical processes include grounding line migration and higher-order stress coupling. • Faithful representation of these ocean/ice-sheet interactions thus emerges as a new frontier for Earth System Models and it may well be the key ingredient in any coupled modeling effort that attempts to quantify and reduce uncertainties in sea level rise projections for the next century.