Download
1 / 25
260 likes | 500 Views
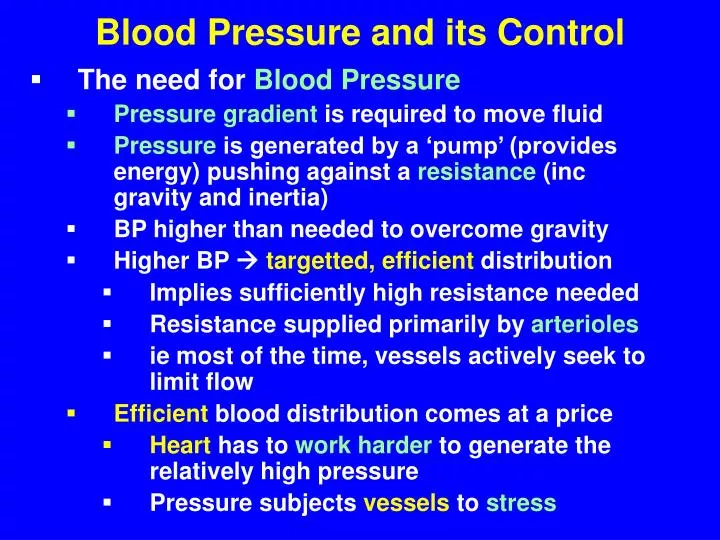
Blood Pressure and its Control. The need for Blood Pressure Pressure gradient is required to move fluid Pressure is generated by a ‘pump’ (provides energy) pushing against a resistance (inc gravity and inertia) BP higher than needed to overcome gravity

E N D
Blood Pressure and its Control • The need for Blood Pressure • Pressure gradient is required to move fluid • Pressure is generated by a ‘pump’ (provides energy) pushing against a resistance (inc gravity and inertia) • BP higher than needed to overcome gravity • Higher BP targetted, efficient distribution • Implies sufficiently high resistance needed • Resistance supplied primarily by arterioles • ie most of the time, vessels actively seek to limit flow • Efficient blood distribution comes at a price • Heart has to work harder to generate the relatively high pressure • Pressure subjects vessels to stress
The Heart is Intermittent Pump, Yet Blood Flow is Continuous • Your heart doesn’t generate pressure for 2/3rds of your life • So what keeps the blood flowing for that 60 years? • The major arteries are very elastic • Some of the energy during systole is ‘captured’ by stretching of the major arteries • During diastole, the arteries recoil passively and continue to maintain pressure and so drive blood around the circulation • That ability to maintain pressure/flow can be affected by… • Hardening of arteries (less elastic) • Lower resistance to flow (exercise)
Determinants of Blood Pressure1) Cardiac Output CO = SV x HR (l/beat x beats/min > l/min)
Determinants of Blood Pressure2) Total Peripheral Resistance • TPR is resistance offered by all blood vessels to blood flow • Main resistance vessels are the arterioles • Resistance prop to 1/radius4 • Radius controlled by smooth muscle cont. via… • Neural activity (vasomotor centre in medulla) • Myogenic activity (intrinsic reaction to stretch) • Circulating factors (egangiotensin) • Local factors (eg NO) • TPR units are mmHg / l /min • BP = CO x TPR • (l/min x mmHg/l/min > mmHg) • Analogous to V = IR (Ohm’s Law)
Determinants of Blood Pressure3) Role of Blood Volume (often ignored) • Blood pressure varies… • With blood vessel type • During the cardiac cycle • BP = CO x TPR • But CO = VR • Heart is a ‘demand’ pump • So BP depends on VR ! • VR influenced by • Respiratory ‘push-pull’ pump • Skeletal muscle contraction • Mean Systemic Filling Pressure • ‘Average’ BP if heart isolated from circulation • Depends on BV • The higher the volume, the higher the MSFP
The Kidneys, Body Water, BV and BP • 40 litres (70kg, 25y male) • Average intake/output 2.3 l/day • Intake • Metabolic reactions 10% • Drink 60% • Food 30% • Output • Urine 60% • Sweat 4% • Faeces 4% • Evaporation 32% • Skin & resp tract • No salt lost via these routes
Fluid Compartments • 40 litres Total • 25 litres Intracellular • 15 litres Extracellular • 3 litres Plasma • 12 litres Interstitial • Usually includes cerebrospinal etc • >90% as a gel
Fluid Movements (ml/min) 125 12,000,000 Kidneys 2 240,000 1.5 1.5 • Intake/output 1.5 • Bulk flow from non-renal capillaries 2 • Bulk flow at renal glomeruli 125 • Water diffusion at body capillaries 240,000 • Water diffusion across RBCs 12,000,000 • Illustrates dynamic equilibrium • Renal adjustment of plasma composition affects other compartments • Renal adjustment of plasma volume affects blood pressure
Short-term BP Control • Seconds • Baroreceptor reflex • Carotid sinus, aortic arch • Inhibits vasomotor centre • Chemoreceptor input • Aortic arch, carotid bodies • Stimulate CV centre when O2, pH drop • CNS ischaemic response • ‘Last ditch’ attempt when CNS perfusion pressure drops • Massive sympathetic outflow • Minutes/hours • Renin-angiotensin • vasoconstriction • Vascular stress-relaxation (delayed compliance) • Veins ‘relax’ around increased BV • Capillary fluid shift • Jv=Kf([Pc − Pi] − σ[πc − πi]) • Individual mechanisms show finite gain
The Renin-Angiotensin System Angiotensinogen NH2-Asp-Arg-Val…Pro-Phe-Hist-Leu…COOH 1. ↓ Renal Perfusion Pressure 2. ↓ Na at Macula Densa cells 3. ↑ Sympathetic nerve activity (ß-1) 1 2 3 7 8 9 10 + Renin NH2-Asp-Arg-Val…Pro-Phe-Hist-Leu-COOH Angiotensin I 1 2 3 7 8 9 10 ACE Angiotensin II NH2-Asp-Arg-Val…Pro-Phe-COOH 1 2 3 7 8 Aminopeptidase Angiotensin III NH2-Arg-Val…Pro-Phe-COOH 2 3 7 8
ANGIOTENSIN II - SUPPORT OF BLOOD PRESSURE Cardiac & Vascular Hypertrophy Vasoconstriction Direct Renal Sodium Retention ↑ Cardiac Contractility Aldosterone Secretion Angiotensin II Sympathetic Facilitation: Central Nerve terminal (ganglionic ?) ↑ Thirst ADH Release All known physiologic effects are mediated by the angiotensin II type 1 receptor
Control Systems: Coping with Changes • When circumstances change… • Most systems do not re-establish original conditions… • …if they are unable to correct the original stimulus for change • Eg central heating • Room temp balance between heat production by boiler and heat loss to outside • When external temp falls, average room temp falls even though heating still on! • Or even water level in cistern with a hole added to it!
Short-term BP Control • Finite gain • Cannot fully reverse effect of BP change • Eg consider baroreceptor response to haemorrhage Error BP Correction Gain = Correction / Error (Error > 0, so gain is finite) Haemorrhage Baroreceptor Activity Vaso- constriction What is sustaining extra constriction? Must be the error
Long-term BP Control • Renal- body fluid-pressure mechanism • Demonstrates infinite gain • Always fully restores BP • (ie never leaves an ‘error’ signal finite gain) • Example • ↑ in BP • ‘pressure’ diuresis & natriuresis • ↓ in BV • ↓ in VR • ↓ in CO • ↓ in TPR (via autoregulation) • ↓ in BP • Process continues until BP back to normal
Graphical Representation • Na+ and H2O intake/output curves Na+/H2O intake/ output (x normal) 1 0 100 200 Blood Pressure (mmHg) • Na+ and H2O intake not BP-dependent • BP regulated at intersection of curves
Importance of Na+ • BV effects on BP mediated by Na+ not H2O • Thought experiment: if ↑ H2O content of body • ↓osmolarity of ECF • ↓ ADH secretion • H2O diuresis • No change in BV • Thought experiment: if ↑ Na+ content of body • ↑ osmolarity of ECF • ↑ ADH secretion / thirst • Antidiuresis / ↑ fluid intake • ↑ in BV
In Changing Equilibrium BP • Thought experiment: Just change Na+intake Out Na+intake/ output (x normal) 1 0 100 200 Blood Pressure (mmHg) • ↑ Na+ intake alone ↑ BP
Out Changing Equilibrium BP • Thought experiment: Just change Na+output Na+intake/ output (x normal) 1 In 0 100 200 Blood Pressure (mmHg) • Right-shifting renal Na+ output alone ↑ BP
Changing renal Na+ output curve • Renal Na+ output determined by hormones • Angiotensin • ↑ Na+reabsorption • Direct effect, and indirect via aldosterone • Aldosterone • Steroid released from adrenal cortex • ↑ Na+reabsorption • ANP • AtrialNatriuretic Peptide • Released from right atrium of heart • ↓ Na+reabsorption • BP does not vary much with Na+intake • Because release of hormones is sensitive to BP and Na+ • Intake/output curves shift together same BP
Combined effect of ↑ Na+ intake Out Na+intake/ output (x normal) 1 In 0 100 200 Blood Pressure (mmHg) • ↑ Na+ intake left-shifts renal Na+ output → BP
Effect of ↑ Na+ intake • ↑ Na+ intake • ↑ body Na+, BV, BP • ↓ Angiotensin, ↓ aldosterone, ↑ ANP • Shift in renal output curve to left • Diuresis, natriuresis • ↓ body Na+, BV, BP
How BP changes with Na+ intake Na+ intake/ output (x normal) 1 0 100 200 Blood Pressure (mmHg)
How BP changes with Na+ intake Na+ intake (x normal) 1 0 100 200 Blood Pressure (mmHg) • alterations in sodium-pressure curves occurs in diseases such as hypertension
The role of Renal Autoregulation • Theory relies on change in renal output in response to change in blood pressure – • ie pressure makes you pee • Original output curves observed in isolated, perfused kidneys • But there are differences between isolated and in situ kidneys • Across a wide range of BP, the in situ kidney autoregulates RBF and GFR, but not the isolated GFR/RBF (ie tendency to produce urine) 1 0 100 200 Blood Pressure (mmHg)
Changing Pressure Changing Pee • Change in output seen in isolated kidney probably due to change in RBF/GFR • ie pressure directly makes the kidneys pee • Effects less likely to happen in situ • Change in output seen in the in situ kidney probably due to changes in Na+reabsorption • Sodium and water strongly linked • Ang, Aldo and ANP are BP-sensitive • Effects unlikely to happen in isolated kidney • So because of autoregulation, shifts in renal output curves in the in situkidney are indirect, via hormones, but occur directly in the isolated kidney by alterations in GFR