Download
1 / 23
480 likes | 1.61k Views
Raster data compression techniques. 1.Run Length Encoding 2. Quad trees. RUN LENGTH ENCODING. Standard Run Length Encoding In Standard Run Length Encoding the value of the attribute,the number of cells in the run, and the row number are recorded. Value Point Encoding

E N D
Raster data compression techniques 1.Run Length Encoding 2. Quad trees
RUN LENGTH ENCODING • Standard Run Length Encoding • In Standard Run Length Encoding the value of the attribute,the number of cells in the run, and the row number are recorded. • Value Point Encoding • In Value Point Encoding the cells are assigned positions numbers starting in the upper left corner, proceeding from left to right and top to bottom.The Position number for the end of each run is stored in the point column. The value for each cell in the run is in the value coloumn
Run Length encoding of raster • A way of encoding raster data that reduces storage requirements by creating linear groups of identical pixels rather than storing the values of each pixel individually. Or • A data compression technique which encodes a digital data stream in terms of the number of successive digital data elements of the same value, rather than repeating every data value.
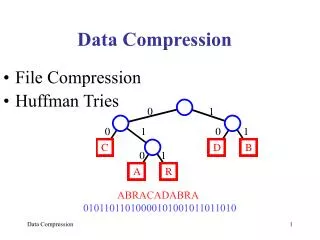
Quad tree Data Model • Quad tree: A way of encoding raster data that attempts to reduce storage requirements by avoiding sub-dividing homogeneous areas rather than storing values for every pixel. Or • A data structure that subdivides any given space into four quadrants and continues to subdivide each quadrant in a similar way until they are uniform or the basic resolution of the data is reached. It is mostly used to compress raster data
Quad tree Model • Compact raster representation by using a variable sized grid cell. • Large cells are used to encode large homogeneous areas. A finer resolution is used for areas of high spatial variability. • Root: point where all other branches expand • Leaf: a point from which there is no further branching
Vector Data Model • Spaghetti Data Model • Topological Model • Triangular Irregular Network (TIN)
Spaghetti Data Model • All spatial features are coded, spatial relation ships between these features are not encoded • Spatial data that is stored as a file of collection of coordinate string with no inherent structure. • This type of vector structure records no information concerning explicit spatial relation ships. • It is efficient for the storage of map data for cartographic display but, it is poor for GIS analysis.
Spaghetti Data Model • A point is encoded as a single XY coordinate pair. • A line is encoded as a string of XY coordinate pairs. • An area is represented by a polygon and is recorded as a closed loop of XY coordinates that define its boundary.
Topological model • A mathematical method used to explicitly define spatial relation ships between geographical elements. • The spatial relationships between connecting or adjacent geographic features such as points, lines, and polygons is specifically specified and stored.
Topological model cont’d… • Also termed as the Arc-Node data Model. • The basic logical entity is arc, a series of points that starts and ends at a node. • Node: A node is an intersection point where two or more arcs meet
Topological Data Model • Polygon Topology • Node Topology • Arc Topology • Arc Coordinate Data
TIN Data Model • A data structure that produces a continuous surface from point data Or A method of creating a surface from point data in the vector data model. The TIN is created from an arbitrary distribution of points joined to form triangles. Each point has an x and y co-ordinate and one or more attributes (e.g. height). Attribute values for a point anywhere in the model can then be interpolated . • TIN is a vector-based topological data model used to represent terrain data • Terrain: ground or a piece of land seen in terms of its surface features or general physical character, especially when crossing it or using it for military purposes
The Triangulated Irregular Network (TIN) cont’d… • A TIN represents terrain data as a set of interconnected triangular facets. • For each of the three vertices the XY coordinate (geographic location) and the Z coordinate (elevation) values are encoded • Elevation: the height above a specific reference point, especially sea level
The Triangulated Irregular Network (TIN) cont’d… • The coordinate data and topology for TIN are stored in a set of tables. • The Node Table lists each triangle and the nodes which define it. • The Edge table lists the three triangles adjacent to each facet. • The XY coordinate and Z coordinate Table store the node coordinate values.
The Triangulated Irregular Network (TIN) cont’d… • Triangles which are more equilateral in shape tend to most accurately represent the surface. • Using a TIN model terrain parameters like slope and aspect are calculated for each facet and stored as an attribute for each facet. • slope: A measure of change in surface value over distance, expressed in degrees or as a percentage. Or • angle that deviates from horizontal • Aspect • refers to the direction a slope faces. That is, if you were standing on a hillside and looking down the slope, the direction you were facing would be the aspect of the slope. It is usually broken into eight catagories: north, northeast, east, southeast, south, southwest, west, and northwest. • Knowing the aspect can give you a lot of information. It tells you what direction water will travel as it runs off the slope
The Triangulated Irregular Network (TIN) cont’d… • Terrain data in digital form are usually provided as a raster data set. The regular grid of values are produced by photogram metric analysis of air photo or satellite stereo pairs. where elevation values are an irregular set of data points, such as elevation contours (an outline of something specially curved or irregular).
The Triangulated Irregular Network (TIN) cont’d… • A regular grid of points can be generated by estimating values for the cells that do not contain data points. • Interpolation: The process of estimating the value for missing points is termed “interpolation”.
The Triangulated Irregular Network (TIN) cont’d… • Advantage of TIN is that extra information is encoded for areas of complex relief without requiring large amount of data to be collected from area of simple relief bcz Size of each facet is variable, smaller triangles and therefore a more detailed representation can be provided where there is a higher density of data points.
The Triangulated Irregular Network (TIN) cont’d… • The disadvantage of TIN compared with a raster representation is that more processing is needed to generate TIN file itself.