Download
1 / 17
170 likes | 293 Views
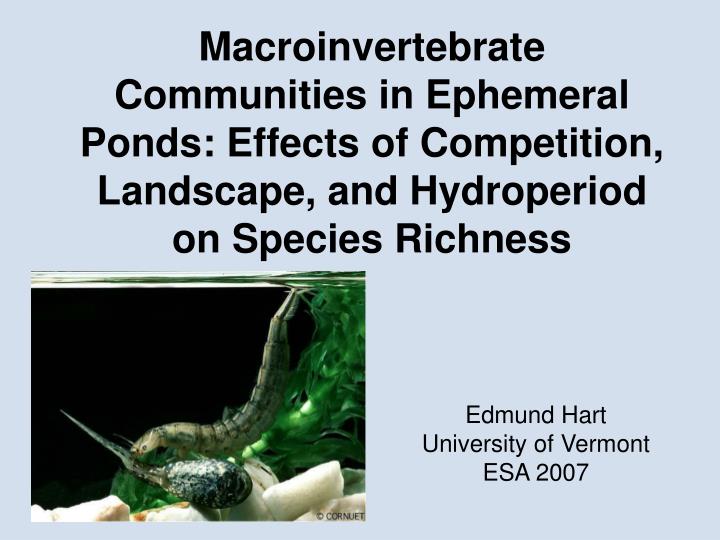
Macroinvertebrate Communities in Ephemeral Ponds: Effects of Competition, Landscape, and Hydroperiod on Species Richness. Edmund Hart University of Vermont ESA 2007. What is an Ephemeral Pond?. A landscape depression regularly filling in either the fall or the spring.

E N D
Macroinvertebrate Communities in Ephemeral Ponds: Effects of Competition, Landscape, and Hydroperiod on Species Richness Edmund Hart University of Vermont ESA 2007
What is an Ephemeral Pond? • A landscape depression regularly filling in either the fall or the spring. • Rarely hold water for more than 4 - 5 months after spring ice out, but can be flooded for multiple years. • Range in size from 68 – 2941 m2 • Regular drying and no inflow or outflow prevents the establishment of fish populations.
Community assembly Communities reform each year with some taxa overwintering, and others colonizing in the early spring. • Only certain taxa can exploit ephemeral habitats.(Wiggins et al 1980, Williams 1997). • Have resting eggs (cladocerans, Branchiopods) or dessicant resistant life stages. • Rapid development (mosquitoes, other Diptera). • Early colonizers from nearby permanent habitat (Hemiptera, Dytiscidae). • Wissinger and Gallagher (1999) found between 63 and 71% of post-drought insect taxa were from dessicant resistant stages.
Schematic of community structure. Hydroperiod .2 .2 .6 .3 .5 .4 .7 .3 .2 .9 .1 = Taxa that can utilize ephemeral habitat .1 .1 .4 .6 .8 .1 .3 .8 .2 = Taxa already present In habitat .9 .5 = Potential colonizer Model drawn after Schnieder and Frost (1996)
Study question Do competitive interactions with salamander larva Or abiotic habitat variables determine invertebrate species richness?
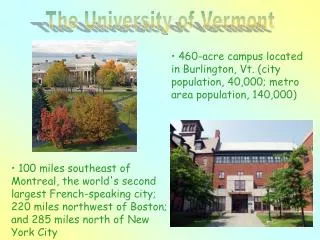
Study Location Delaware Water Gap National Recreation Area • 67,000 acres in New Jersey and Pennsylvania bordering 40 miles of the Delaware river. • Includes two large ridges on either side of the river valley and numerous tributaries.
Experimental Design I. Two independent factors crossed, third added post-hoc • Open or closed canopy • Ambystoma spp. larva present or absent • Third factor added, late or early drying • One site for each of the initial factors, 4 total sites
Experimental Design II. Sites sampled every other week from 3/25/04 to 6/25/04 or until dry • Three 1-Meter dipnet sweeps taken and then pooled, and picked for 10 minutes to make 1 composite sample • Three composite samples taken per visit. • All three samples pooled into a single species richness count per sampling date
Model Development and Analysis Data was analyzed using the lmer function for mixed models in the lme4 package (Bates and Sarkar 2007) of R (R Development Core Team 2007). • Calculated Aikake’s Information for small sample sizes (AICc) (Burnam and Anderson 2002) • Calculated Aikake weights, • Calculated model selection frequencies and 95% confidence intervals using 10,000 bootstrap replicates
Candidate Models Since design was not fully crossed, a saturating likelihood results when too many factors are added into the model. Therefore interaction terms could not be considered, only additive effects of two parameters.
Results Species Richness by Treatment
Results Individual based rarefaction curves generated by EstimateS (Colwell 2005). Open sites have higher species diversity.
Model Results The model with habitat and hydroperiod predictors best fits the data, also having the highest AICc weight and bootstrap frequency.
Conclusions • The strongest predictor of species richness was abiotic habitat variables. • Open habitat was a strong predictor on its own. • Open habitats could be better quality habitat (Tarr et al 2005) • Open habitats are more detectable by aerial colonizers (My own wild rank speculation) • Competitive interactions with Ambystoma larva have little impact on macroinvertebrate species richness. • Agrees with Corti et al’s (1997) prediction of low effects of predation on highly disturbed systems • Also larval densities probably didn’t reach high enough levels
Questions? Worms sure are tastier than bugs Thanks DEWA staff, Rich Evans, USGS BRD Brian Beckage, Nick Gotelli