Download
1 / 3
30 likes | 156 Views
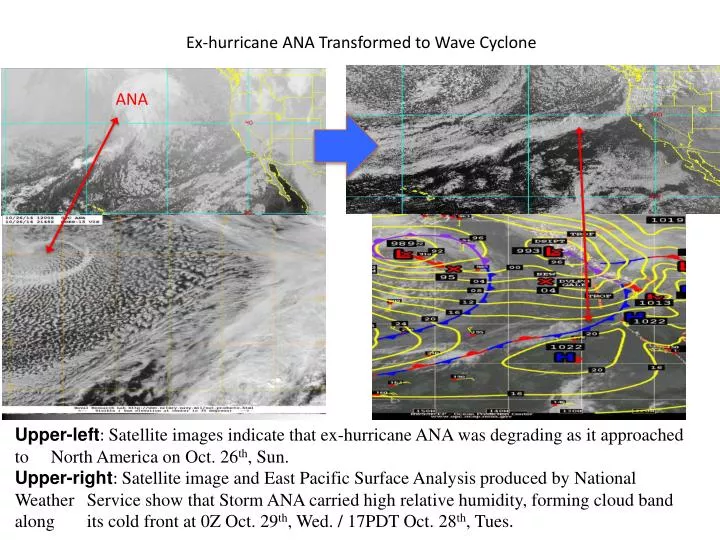
Ex-hurricane ANA Transformed to Wave Cyclone. ANA. Upper-left : Satellite images indicate that ex-hurricane ANA was degrading as it approached to North America on Oct. 26 th , Sun.

E N D
Ex-hurricane ANA Transformed to Wave Cyclone ANA Upper-left: Satellite images indicate that ex-hurricane ANA was degrading as it approached to North America on Oct. 26th, Sun. Upper-right: Satellite image and East Pacific Surface Analysis produced by National Weather Service show that Storm ANA carried high relative humidity, forming cloud band along its cold front at 0Z Oct. 29th, Wed. / 17PDT Oct. 28th, Tues.
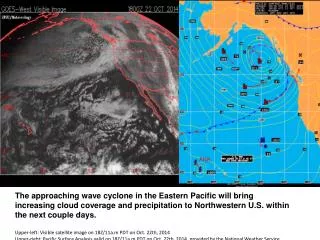
At 6Z Oct 29th, Wed /23PDT Oct 28th, Tues, Storm ANA has dissipated as its cold front overtook its warm front. Yet, its remnant moisture continues to contribute to another low pressure system approaching North America at 12Z/5PDT Oct 29th, Wed. This new low pressure system brings a chance of precipitation to the SF Bay Area on Oct 31st, Fri. Left: East Pacific Surface Analysis for 6Z and 12Z on Oct 29th, produced by National Weather Service; The red crosses show the positions where the patterns will move in the next 24 hours. Right: Satellite image of East Pacific at 12Z Oct 29th ANA dissipated
Cold Front with Moisture Approaching the Northwest Coast Brings a Chance of Precipitation into North Bay Area Left: Surface isobar and 1000mb-500mb thickness contour forecast for Oct 31st, Fri. Right: Relative Humidity (Green means high RH, suggesting cloud formation) and 700mb geopotential height contours for Oct 31st, Fri.