Download
1 / 10
100 likes | 111 Views
This study examines the expression and methylation patterns of various genes involved in colorectal cancer (CRC) progression, including AREG, EREG, and VEGFR2. The findings highlight potential biomarkers and therapeutic targets for CRC.

E N D
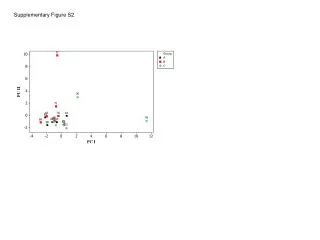
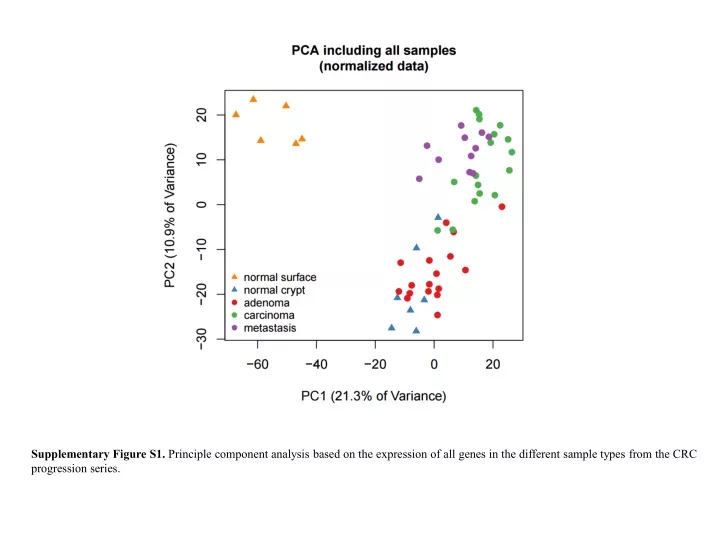
Supplementary Figure S1. Principle component analysis based on the expression of all genes in the different sample types from the CRC progression series.
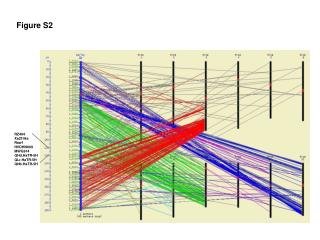
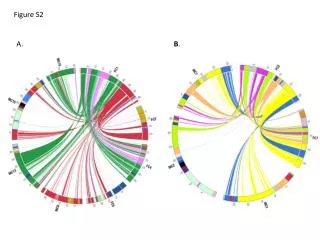
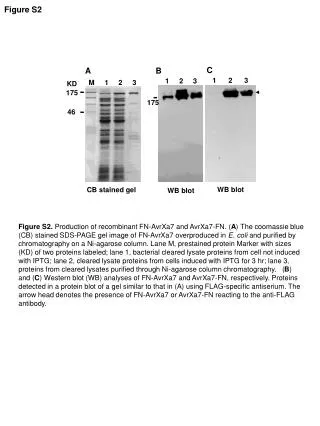
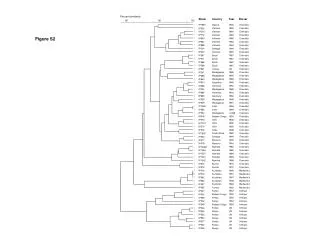
Adenoma Carcinoma Metastasis Adenoma Carcinoma Metastasis Supplementary Figure S2. Mutations detected by NGS during CRC progression.
b a A: Normal **** A A C C B B 60μm 6mm B: Adenoma C: Carcinoma 60μm 60μm Supplementary Figure S3. AREG expression is confined to colon epithelial cells. AREG is expressed in normal colonic epithelium and in adenomas, and is up-regulated in carcinomas. (a) Representative ISH images of AREG in normal, adenoma and carcinoma samples. (b) Summary of AREG ISH scores in different cell types. ****P < 0.0001.
Supplementary Figure S4. EREG promoter methylation at probes cg.19308222 and cg.11646192 in normal tissues, adenomas, carcinomas and metastases.
Pearson R= -0.29 Pearson P= 0.1 Pearson R= -0.17 Pearson P=0.33 Supplementary Figure S5. Lack of a significant correlation between AREG expression and methylation was seen in CRC progression samples using two independent probes.
MLH1/CIMP vs. EREG Methylation MLH1/CIMP vs. EREG Expression a b EREG Probe: cg19308222 EREG Probe: cg11646192 EREG EREG d c AREG Probe: cg03244277 AREG Probe: cg02334660 AREG AREG Supplementary Figure S6. EREG and AREG methylation and expression status in CIMP+ vs. CIMP- CRC tissues from the TCGA collection, as measured by MLH1 promoter methylation. (a) EREG methylation is significantly higher, and (b) EREG expression is significantly lower in in MLH1/CIMP+ tissues. (c, d) a similar relationship was observed between AREG methylation and expression in MLH1/CIMP+ tissues.
1.2 ) s l l e c l o r t n 0.9 o c d e y t t i a l i e b r a t i 0.6 v O l S l e M C D o t e z i 0.3 l a m r o N ( 0.0 a b *** Log2 (EREG RPKM) CL11 + erlotinib CL11 + erlotinib + 5-aza-dC SW48 + erlotinib SW48 + erlotinib + 5-aza-dC DMSO 0.11μM erlotinib 0.33μM erlotinib 1μM erlotinib EREG promoter methylation (M) Supplementary Figure S7: 5-aza-dC treatment significantly enhanced the sensitivity to erlotinib in CRC cells with high endogenous levels of EREG promoter methylation. (a) Normalized EREG expression and methylation levels at probe cg.19308222(M-value) are negatively correlated across 40 CRC cell lines. (b) Effects of 5-Aza-dCR on viability of colon cancer cell lines treated with erlotinib. Cells were pretreated with DMSO or 5-aza-dC(500nM) for 2 days and then exposed to 0.11μM, 0.33μM and 1μM of erlotinib alone or in combination with 5-aza-dcC(250nM). After 3 days, cell viability was measured using CellTiter-Glo Luminescent Cell Viability assay. Two sided P-values were derived using an unpaired t-test. *** P < 0.001
b a % Best CT Response EREG Expression(-dCt) AREG Expression(-dCt) AREG Expression(-dCt) Supplementary Figure S8. Correlation between AREG expressionand EREG expression and clinical response in tumors from the MEHD7945A + FOLFIRI phase 2 clinical trial. (a) AREG and EREG expression are highly correlated. (b) AREG expression was not significantly correlated with % best CT response.
Supplementary Figure S9. Bar chart reflecting the inverse correlation between AREG promoter methylation and expression across all TCGA indications with detectable AREG. Abbreviations: Pancreatic adenocarcinoma (PAAD), Brain lower grade glioma (LGG), Kidney renal papillary cell carcinoma (KIRP), Rectum adenocarcinoma (READ), Colon adenocarcinoma (COAD), Stomach adenocarcinoma (STAD), Glioblastoma multiforme (GBM), Breast invasive carcinoma (BRCA), Bladder urothelial carcinoma (BLCA), Head and neck squamous cell carcinoma (HNSC), Thyroid carcinoma (THCA), Prostate adenocarcinoma (PRAD), Lung adenocarcinoma (LUAD), Skin cutaneous melanoma (SKCM), Liver hepatocellular carcinoma (LIHC), Kidney renal clear cell carcinoma (KIRC), Uterine corpus endometrioid carcinoma (UCEC), Lung squamous cell carcinoma (LUSC), Cervical squamous cell carcinoma and endocervical adenocarcinoma (CESC), Acute myeloid leukemia (LAML).
VEGFR2-Y1175 a b NS VEGFR2-Y996 * NS NS * NS RPPA log2 intensity (normalized to VEGFR2) RPPA log2 intensity (normalized to VEGFR2) Adenoma Carcinoma Metastasis Adenoma Carcinoma Metastasis c ** Adenoma Carcinoma Metastasis Normalized gene expression (Mean + one standard error, log2) VEGFA VEGFB VEGFC FLT1 KDR Supplementary Figure S10. Activation of VEGFR2 as measured at two receptor phosphorylation sites Y1175 (a) and Y996 (b) is associated with increased levels of the ligand VEGFA (c) during CRC progression. * P < 0.05, ** P < 0.005, NS: not significant.