Download

1 / 16
170 likes | 277 Views
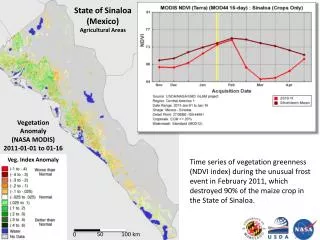
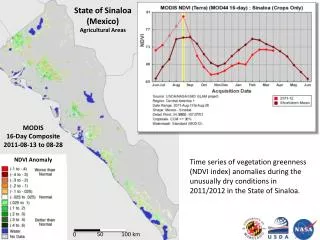
Daily NDVI relationship to clouds. TANG , Qiuhong The University of Tokyo IIS, OKI’s Lab. PUB. P rediction in U ngauged B asins Relatively reliable P rediction in U n-ground-gauged B asins. Ungaused Basin B. Ungauged Basin A. PUB and observation.

E N D
Daily NDVI relationship to clouds TANG,Qiuhong The University of Tokyo IIS, OKI’s Lab.
PUB Prediction inUngauged Basins Relatively reliable Prediction inUn-ground-gauged Basins Ungaused Basin B Ungauged Basin A
PUB and observation • If there isn’t information of the basins, we cannot estimate hydrological response. “UNGAUGED” (Un-ground-gauged) Indirectly ‘gauge’ (observation/information) Remote sensing Similar climate zone data • What’s gauged? What’s ungauged? What’s PUB? • PUB started with the geophysical science.
PUB model forcing data “UNGAUGED” Remote sensing Similar climate zone data Available for RS Describe Land Surface DEM, Land Cover, … Unavailable for RS Temperature, Wind speed Vapor pressure… DEM: geomorphologic factor to hydrological response Land Cover: vegetation phonology to hydrological response Wind speed, vapor pressure etc. : regional climate forcing RS Interpolate RS: Unreliable, distributed data | Ground observation: Reliable, point data
Land Cover: NDVI data • NDVI = (NIR-Red) / (NIR+Red) • NDVI (normalized difference vegetation index) Satellite NDVI cloud ‘True’ NDVI
Cloud Index from Ground Observation • Cloud Amount • Sunshine Index = n/N • Where, n is duration of sunshine • and N is maximum possible sunshine
Comparison (Satellite & Ground Based Cloud Index) • R-squared value between daily NCI values and the observed cloudamount (Left) and Sunshine time index (right). (1995-2000, 120 stations)
Comparison (Satellite & Ground Based Cloud Index) • RMSE value between daily NCI values and the observed cloudamount (Left) and Sunshine time index (right). (1995-2000, 120 stations)
.00-.09 .09-.25 .25-.36 .36-.49 .49-.64 .00-.09 .09-.25 .25-.49 .49-.64 .64-.81 Comparison (Satellite & Ground Based Cloud Index) Satellite data vs. Interpolate to all over the River Basin R-squared value between daily NCI values and the observed cloudamount (Left) and Sunshine time index (right). (1995-2000) The poorest relationship in the Tibet Plateau (red circle) might due to the distortion of satellite scans.
Comparison (R2) > 80% > 90% Distribution of R-squared values over the study area. NCI and Cloud Amount Index (left), NCAI and Sunshine Index (right).
Comparison (RMSE) • The root-mean-square error (RMSE) associated with NCI and cloud amount ranges from 0.21 to 0.30 with an averaged value of 0.25. • For Sunshine time, RMSE ranges from 0.16 to 0.26 with an averaged value of 0.20.
Comparison USGS Land use The daily NCI versus observed cloud amount and SCAI relationships are strong and land cover independent expect for water body
Conclusion • The NCI and observed cloud index retain a high correlation coefficient suggesting that NCI may be useful for estimating clouds influence to solar radiation. Satellite data (NDVI) Ground based observation (cloud amount, sunshine) Solar radiation
Solar and Scan Geometry Sunshine – NCI a Sunshine – NCI b