Download
1 / 43
430 likes | 559 Views
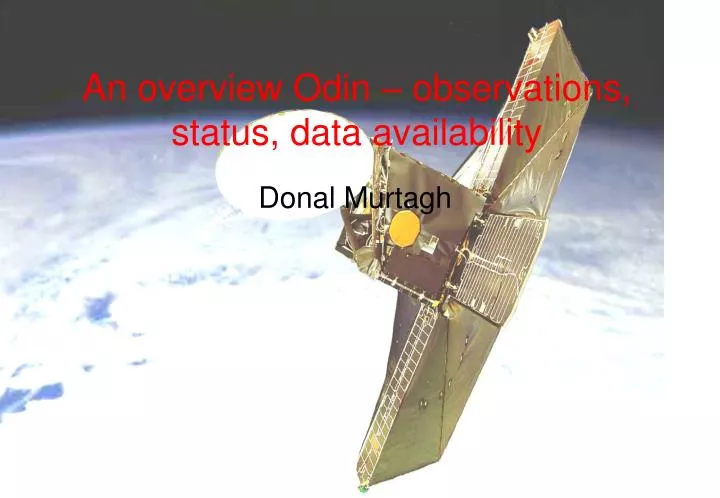
An overview Odin – observations, status, data availability. Donal Murtagh. Aeronomy /Astronomy Carpet. Measurements performed. SMR O 3 , HNO 3 , ClO and N 2 O Resolution 1.5 -3 km Altitude coverage 15 (20) – 60 km Other SMR modes SMR: H2O, CO (upper strat), NO, HDO, H2O2, HO2,

E N D
An overview Odin – observations, status, data availability Donal Murtagh
Measurements performed • SMR • O3, HNO3, ClO and N2O • Resolution 1.5 -3 km • Altitude coverage 15 (20) – 60 km • Other SMR modes • SMR: H2O, CO (upper strat), NO, HDO, H2O2, HO2, • OSIRIS when sunlit • O3, NO2 (OClO , BrO) • Resolution 1.5 km • Altitude Coverage 10(15) – 50 km
Odin measurement modes • Basic Stratospheric mode • SMR: O3, N2O, HNO3, ClO, (H2O) • OSIRIS O3, NO2, (OClO, BrO), aerosols • Other SMR modes • SMR: H2O, CO (upper strat), NO, HDO, H2O2, HO2,
Types of studies being made • Chlorine activation and ozone loss • Denitrification • Data assimilation • Water isotopes • Global scale transport processes
Comparisons OSIRIS Flittner – SMR 501 GHz Ozone • Comparision made on a profile by profile basis for each month of 2003 • OSIRIS flittner ver 2.1 and Chalmers 501 GHz ozone ver 1.2 • In these plots no height adjustment has been applied.
Conclusions on comparison • The Flittner is clearly under the SMR 501 GHz at altitudes above 35 km which I understand is in good agreement with the comparison with POAM and probably due to the lack of shorter wavelengths in the Flittner analysis. • There is good <5 - 10 % difference in the altitude region approx 22-35 km. • SMR tends to overestimate Ozone below 22 km - reasons to be checked • Some new thoughts can be: • The agreement between Chalmers SMR and Flittner improves at lower solar zenith distances ie higher sun - which might be expected since the RT models often perform better under such conditions. However while this is true in the regions of good agreement it may not be so in the regions of worse agreements ie z>35 km • There are some large discrepancies in the ozone hole region that need sorted out. • Worth noting : I have not tried to apply any altitude corrections on the individual profiles.
The dynamical situtation as depicted by N2O 475 K Minor warming Major warming
Types of studies being made • Chlorine activation and ozone loss • Denitrification • Data assimilation • Water isotopes • Global scale transport processes
HNO3 – N2O Correlation SH 2003 NH 2002-2003
Approach • Make vortex average HNO3 and N2O on Potential temperature surfaces. • Use Popp et al correlation to compute NOy* • Estimate denitrification as HNO3- NOy*
2D-Model Zonal Means comparison SEPTEMBER 2002 2D-model from Martin Ridal (Ridal, 2001)
Full mission climatology separated by Odin local time Thin clouds All clouds Evening Evening Evening Morning Morning Morning
Ozone and N2O in the south polar vortex in the winter of 2003
19 Sept. 2002: orbit 8565 8565045 8565049 * Only the measurement error is plotted. Scan 8565045 Lat: 88 S, Lon: 15 W, SZA: 92.1 Scan 8565049 Lat: 71 S, Lon: 33 E, SZA: 91.8
Results . . . Occurance frequency in various altitude bands (NH 2003 and SH 2003/04). wavelength 405 nm,threshold Lpeak > 7109 ph cm-2 s-1 nm-1 str-1) Next steps: Spectral Analysis, Particle Sizes and more . . .
Coincidence criteria: UT = 5h, Lat = 5o, Lon = 5o Coincident SABER Kinetic Temperature and OSIRIS PMC Relative Brightness during the summermesospheric campaigns of 2002 and 2003
Conclusions • Odin data is now being used for scientific studies • Opportunities for synergistic studies with OSIRIS and SMR
Programme planning 1 • 2 new Strat meso modes to exploit the fact that the 577 GHz radiometer is phase locked • Include CO and HO2 • Include NO and H2O-17 • 2 of the 5 stat-meso days to be used for these modes maintaining the water measurements • CO measurements on 1 strat day (increased scan range)
Programme planning 2 • Two days are planned to investigate the use of a short scanning range 7-30 km for UTLS studies • 1 for CO and H2O at 503 GHz • 1 for CO with N2O