Download
1 / 29
290 likes | 421 Views
RD50 Workshop, CERN, 14-16.11.2012. Temperature dependence of the bulk current in Si. A.Chilingarov Lancaster University. Layout Review of the published results Lancaster data Discussion Conclusions

E N D
RD50 Workshop, CERN, 14-16.11.2012 Temperature dependence of the bulk current in Si A.Chilingarov Lancaster University
Layout • Review of the published results • Lancaster data • Discussion • Conclusions • The talk is based on the RD50 Note: A.Chilingarov, “Generation current temperature scaling. Part-II: Experimental data”, 12.7.2012. • http://rd50.web.cern.ch/rd50/doc/Internal/rd50_2011_001-I-T_scalingExpV2.pdf • though the analysis for p-type sensors is slightly different. A.Chilingarov, I -T scaling, 15.11.2012
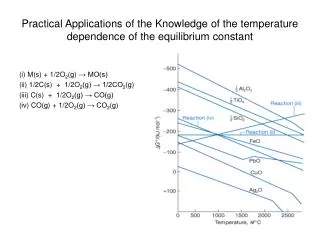
1. Review of the published results The temperature dependence is typically parameterised as: I(T) T2 exp (-Eeff/2kT) Only the data for irradiated sensors, where the bulk generated current usually dominates, were reviewed. Experimental results were found in the following publications: 1. T.Ohsugi et al., NIM A265 (1988) 105. 2. M.Nakamura et al., NIM A270 (1988) 42. 3. K.Gill et al., NIM A322 (1992) 177. 4. E.Barberis et al., NIM A326 (1993) 373. 5. H.Feick, PhD Thesis, DESY F35D-97-08, 1997, Table E.6. (No information on the studied sensors and their irradiation is available.) 6. L.Andricek et al., NIM A436 (1999) 262. 7. ATLAS SCT Barrel Module Final Design Review, SCT-BM-FDR-7, 2002, p.19. (The quoted result is Eeff /2k = 7019K which gives Eeff =1.210 eV.) 8. A.Hickling et al., Technical Note CERN-LHCb-PUB-2011-021, December 30, 2011. A.Chilingarov, I -T scaling, 15.11.2012
Table 1. The values of Eeff observed with irradiated n-type Si sensors [1] particles crossing the VELO system in LHCb detector [2] 1 MeV neutron equivalent A.Chilingarov, I -T scaling, 15.11.2012
Some authors use the parameterisation I(T) Tm exp (-Eeff/2kT) with m≠2. In this case Eeff may be corrected at any temperature to the equivalent Eeff with m=2: Eeff.eq=Eeff(m)+2kT(m-2). Note that this approximation is valid only for the temperatures around the value of T used in the above equation. In Ref.3 the authors used m=3/2 and obtained Eeff=1.34 eV. This result was corrected to m=2 at a typical for Ref.3 data temperature T=293, which gave Eeff=1.31 eV presented in Table 1. In the talk E.Verbitskaya et al., “Temperature dependence of reverse current of irradiated Si detectors”, 20th RD50 Workshop, Bari, May 30 – June 1, 2012, the value of m=0 was used for the fits in the interval 200-400K. The obtained Eeff=1.30 eV. Correcting this result to m=2 at T=273, characteristic for the Table 1 data, gives Eeff.eq= 1.21 eV close to the average of the values observed in other experiments. However since the I(T) parameterisation in this work differs significantly from the standard one while the temperature range used for the fit is quite wide this result was not included in Table 1. A.Chilingarov, I -T scaling, 15.11.2012
2. Lancaster data Table 2. Sensors and their irradiation IV measurements were made with the guard ring grounded. Both total current, It, and that through the sensor centre, Ic, were measured. A.Chilingarov, I -T scaling, 15.11.2012
Usually I(T) dependence is measured at a fixed bias. A natural bias choice is at or just above the full depletion voltage. We have investigated the variation of I(T) dependence with bias in a wide voltage range. For the current generated in the bulk the results should not depend on bias. Thus the variation of Eeff with bias is a good check of consistency of the data with the assumed model. A common problem in measuring I(T) dependence is a danger of sensor self-heating at high power dissipation. This manifests itself as a steady increase of Eeff with bias, which may be suppressed by a proper choice of the bias values. A.Chilingarov, I -T scaling, 15.11.2012
Sensor x2y4 irradiated by 1013 n/cm2 Ic-V curves A.Chilingarov, I -T scaling, 15.11.2012
To equalise the weight of the points with very different current values the errors of 1% were assigned to the points and used in the fit. Typical c2/Ndf was ~0.25, i.e. typical spread of the points around the fit curve was ~0.5% Bias points from 5 to 490V were grouped by 3 and the average current for each group was fit by T2 exp(-Eeff/2kT) as a function of temperature. A.Chilingarov, I -T scaling, 15.11.2012
There are no signs of the sensor self-heating. Maximum dissipation power It*U=3 mW. The Eeff values as a function of bias for the temperature ranges from -32oC to the Tmax of 0oC and -8oC. Average value is calculated using the filled points. A.Chilingarov, I -T scaling, 15.11.2012
Sensor x4y1 irradiated by 1014 n/cm2 Ic-V curves A.Chilingarov, I -T scaling, 15.11.2012
To eliminate the sensor self-heating only the points with dissipation power It*U<3mW were used for the final Eeff calculation. These points are shown by the filled symbols. Average Eeff was first calculated for each of four selected temperature ranges and then these values were averaged. Bias points were grouped by 5 and the average current for each group was fit by T2 exp(-Eeff/2kT) as a function of temperature with 1% errors. This was done for 6 temperature ranges with Tmin=-31oC and Tmax from -24oC to -4oC. The c2/Ndf was <0.5 i.e. the actual errors were <0.7%. A.Chilingarov, I -T scaling, 15.11.2012
Sensor x5y2 irradiated by 1015 n/cm2 Ic-V curves A.Chilingarov, I -T scaling, 15.11.2012
To eliminate the sensor self-heating only the points with dissipation power It*U<3mW were used for the final Eeff calculation. These points are shown by the filled symbols. Average Eeff was first calculated for each of four temperature ranges and then these values were averaged. Bias points from 10 to 540V were grouped by 3 and the average current for each group was fit by T2 exp(-Eeff/2kT) as a function of temperature with 1% errors. This was done for 4 temperature ranges with Tmin=-32oC and Tmax from -24oC to -18oC. The c2/Ndf was ~0.5 i.e. the actual errors were ~0.7%. A.Chilingarov, I -T scaling, 15.11.2012
Sensor S62 irradiated by 0.8∙1014 n/cm2 Ic-V curves A.Chilingarov, I -T scaling, 15.11.2012
Eeff has a plateau between 100 and 300V. The points shown by the filled symbols were used for the final Eeff calculation. Bias points from 5 to 500V were grouped by 5 and the average current for each group was fit by T2 exp(-Eeff/2kT) as a function of temperature with 5% errors. The c2/Ndf was ~0.5 i.e. the actual errors were ~3.5%. A.Chilingarov, I -T scaling, 15.11.2012
Sensor M41 irradiated by 1.1∙1014 n/cm2 Ic-V curves A.Chilingarov, I -T scaling, 15.11.2012
Eeff has a plateau only for the temperature range without 16oC. The points shown by the filled symbols were used for the final Eeff calculation. Bias points from 3 to 260V were grouped by 3 or 4 in 8 bias groups. The average current for each group was fit by T2 exp(-Eeff/2kT) as a function of temperature with 5% errors. This was done for 2 temperature ranges with and without T=16oC. The c2/Ndf was ~0.5 i.e. the actual errors were ~3.5%. A.Chilingarov, I -T scaling, 15.11.2012
Table 3. Summary of Lancaster results Average Eeff was calculated with equal weight for all points i.e. ignoring the errors in the last column * For the bias range 10÷100 V. A.Chilingarov, I -T scaling, 15.11.2012
Eeff from Table 3 vs. fluence. Within errors all points are consistent with their average. A.Chilingarov, I -T scaling, 15.11.2012
3. Discussion Bias dependence of the Eeff is a crucial test of the data consistency with the assumption that the measured current is dominated by that generated in Si bulk. At high power dissipation the Eeff usually grows with bias because of the sensor self-heating. There is no clear correlation between the depletion voltage and the plateau area in the Eeff vs. bias. A.Chilingarov, I -T scaling, 15.11.2012
4. Conclusions • Lancaster measurements give Eeff=1.211±0.008 eV. This result is valid for both p-type and n-type sensors and for the fluence up to 1015 n/cm2. • The published results have the average value of 1.215 eV with the spread of ~0.05 eV. • 3. Both values agree with the expected Eeff = 1.21 eV obtained as explained in the RD50 Note RD50-2011-01. • 4. An analysis of Eeff dependence on bias is crucial for selecting the data representing the bulk current. Absence of such analysis in the literature data may be responsible for a relatively wide spread of the Eeff values there. A.Chilingarov, I -T scaling, 15.11.2012
Acknowledgements The author is grateful to Graham Beck, QMUL, UK and Taka Kondo KEK, Japan for helpful and illuminating discussions. A.Chilingarov, I -T scaling, 15.11.2012
Back-up slides A.Chilingarov, I -T scaling, 15.11.2012
The current per unit area generated inside the depleted bulk can be written as: J(T) = qWni /tg where q is elementary charge, W – depleted thickness, ni – intrinsic carrier concentration and tg – generation lifetime. Temperature dependence of ni can be expressed as: ni T3/2 exp(-Eg /2kT) where Eg is the band gap. A.Chilingarov, I -T scaling, 15.11.2012
Assuming generation happening via a trap with density Nt and level Et in the band gap the generation lifetime can be written as: tg = tp exp(Dt /kT) + tn exp(-Dt /kT) where Dt = Et – Ei (Ei is intrinsic Fermi level) and tp(n) is the trapping time for holes (electrons): tp = 1/Nt vthpsp ; tn = 1/Nt vthnsn . Here vthp(n) is the thermal velocity and sp(n) - trapping cross-section for holes (electrons). A.Chilingarov, I -T scaling, 15.11.2012
Assuming that Nt and cross-sections are independent of temperature and neglecting weak temperature dependence of the effective carrier masses the trapping times can be scaled with temperature as: tp(n) T-1/2 . If tp≈ tn the tg dependence on Dt /kT is close to cosh(Dt /kT). Thus tg is at minimum and the current generation is most effective when Dt≈ 0. For │Dt │/kT >1.5 the cosh is reduced to exp(│Dt│kT). Therefore the current scaling with temperature is usually expressed as: I(T) T2 exp(-(Eg+2D)/2kT) where D is a parameter close to │Dt│ and usually is expected to be nearly zero. A.Chilingarov, I -T scaling, 15.11.2012
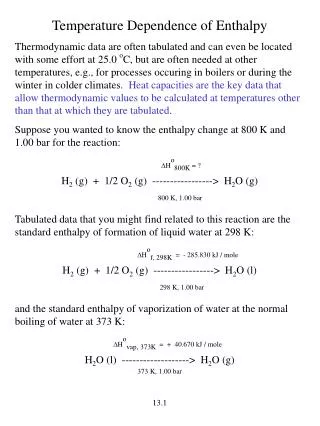
The experimental value of the effective band gap for ni(T) is: Eef= 1.206 ± 0.004 eV. It looks inconsistent with the actual band gap, Eg : 1.124 eV at 300K and 1.137 eV at 250K. Note however that temperature independentEef should incorporate also the temperature dependence of Eg. Most easily this is done if Eg(T) can in some temperature interval be expressed in a linear form: Eg = E0 – a T, where E0 is the extrapolation of Eg to T=0. Then: A exp(-Eg /2kT) = A exp (-E0 /2kT + a/2k) = A´ exp (-E0 /2kT). In the interval 250 – 415 K the Eg(T) can be parameterised by the linear equation valid within 1meV accuracy with E0 = 1.206 eV in perfect agreement with the experimental results for Eeff. A.Chilingarov, I -T scaling, 15.11.2012
Silicon Band Gap This plot is taken from the 2002 talk “Band Gap Regulator Analysis” by J.B.Biard, Honeywell. (Many thanks to Graham Beck, QMUL for picking up this talk!) From -40o to +200oC the Eg(T) can be expressed within 1.5meV accuracy by a linear equation with E0=1.206eV. 3 A.Chilingarov, I -T scaling, 15.11.2012