1 / 21

The UNEP Risoe CDM Pipeline

Global Carbon Markets 8. August 2011 Jørgen Fenhann. The UNEP Risoe CDM Pipeline. Differentiated global carbon markets. Source: Marie Christiansen, Ministry of Climate and Energy, Denmark, 2009. The monthly number of new CDM projects were around 100.

maxime
Download Presentation

The UNEP Risoe CDM Pipeline

An Image/Link below is provided (as is) to download presentation Download Policy: Content on the Website is provided to you AS IS for your information and personal use and may not be sold / licensed / shared on other websites without getting consent from its author. Content is provided to you AS IS for your information and personal use only. Download presentation by click this link. While downloading, if for some reason you are not able to download a presentation, the publisher may have deleted the file from their server. During download, if you can't get a presentation, the file might be deleted by the publisher.

E N D

Presentation Transcript


  1. Global Carbon Markets 8. August 2011 Jørgen Fenhann The UNEP Risoe CDM Pipeline

  2. Differentiated global carbonmarkets Source: Marie Christiansen, Ministry of Climate and Energy, Denmark, 2009

  3. The monthlynumber of new CDM projectswerearound100

  4. Time development of secondary CERs.(670Million CERs have beenissued = 6.7Billion € at 10 €/tonCo2)

  5. Project types

  6. How large are the projects?

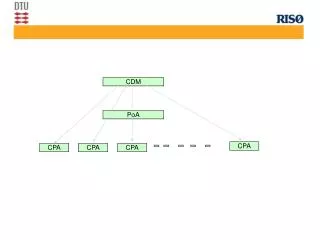
  7. In the CDMPipeline the project in each Type are disaggregated in Sub-types

  8. Which sectors are prevailing globally and in Africa?

  9. The renewable energy category is rising fastest

  10. Some countries take most

  11. Some regions are behind

  12. The most active countries in Latin America

  13. The most active countries in Asia

  14. Africa is catching up Start of Nairobi Framework

  15. Who is buying The CDMPipeline contains 450 buyers

  16. The top 20 PDD Consultants The Pipeline contains 1550 PDD consultants

  17. In 2008 only 31% of the projectsrequesting registration wereregisteredautomatically, 36% in 2009

  18. How large are the time delays in the project cycle?

  19. How many CERs will be available end of 2012, due to delays, no positive validation, rejection, issuance delay and issuance succes

  20. Of the 128000 Million US$ invested in registered CDM projects

More Related