Download
1 / 56
570 likes | 723 Views
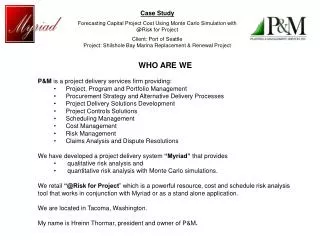
Calculating Risk of Cost Using Monte Carlo Simulation with Fuzzy Parameters in Civil Engineering. Michał Bętkowski Andrzej Pownuk Silesian University of Technology, Poland. Risk of cost overruns. We can define risk as possibility of occurrence of loss.

E N D
CalculatingRisk of Cost Using Monte Carlo Simulation with Fuzzy Parameters in Civil Engineering Michał Bętkowski Andrzej Pownuk Silesian University of Technology, Poland
Risk of cost overruns • We can define risk as possibility of occurrence of loss. • There is always the difference between the planned costs and real costs.
Direct costs are expenses that are directly linked to the project For example: materials, labour, equipment etc. Other costs. For example: management costs, cost of insurance etc. Calculating of cost Direct costs (DC) Indirect costs (IC)
Estimating of direct cost (DC) • The project can be decomposed into elements
DC = Cost 1 + Cost 2+ Cost 3 Direct cost (DC) Cost 1 Cost 2 Cost 3 Materials Labour Equipment
Methods of calculating of directional cost • Deterministic • Probabilistic
Deterministic methods of calculating costs • - appearance of task is deterministic • - cost of each task is deterministic
Calculating Risk in deterministic methods • Risk in deterministic methods is taken into account as additional constant component of cost. • (It is possible to express the risk in percent)
Typical problems with deterministic methods of calculating of costs • Unknown characteristics of costs (labour, whether), • - Alternative tasks, • - Additional tasks.
Probabilistic methods • Alternative tasks • Additional task • Changeable costs of tasks
Alternative tasks Begin hamburger Cola Beer End
Additional task Begin hamburger Cola Beer chips End
Changeable costs of tasks • Old car is cheaper than the new one
Probabilistic definition of risk - real cost (random variable) - fixed cost
Risk of cost Probabilistic definition of risk Probability density function Cumulative distribution function
Total cost = Cost 1 + Cost 2 or Total cost = Cost 1 + Cost 3 Alternative tasks Cost 1 Cost 2 Cost 3
Existing software - Pert Master, - Risk, - MS Project Etc.
Advantages of probabilistic methods • - Express realistic character of the realization of the process. • - Using probabilistic methods it is possible describe random parameters (unpredictable weather, material cost, inaccurate materials estimates)
Because of that we do not know reliable statistical data Limitation of pure probabilistic methods • - unique character of many civil engineering project • - different conditions of the realization (weather, geological conditions, geographical region etc.)
Main problem • It is very difficult to obtain exact values of probabilistic characteristics of the structure • For example: m, σ etc.
Basic assumption • According to many experiments parameters of the system can be characterized by typicalprobability distribution of cost (if we know the data): • Normal distribution • Beta-Pert distribution • Lognormal distribution etc.
However we do not know the parameters Probability density function of costs
What we know? • We know deterministic values of costs from the catalogue • We have expert knowledge about particular cost (i.e. what happened usually) • Sometimes we have some experimental data
Information from experts • Lower bound • Upper bound • Most probable cost
If we have many experts then we can get more information • Lower bound • Upper bound • Most probable cost
Fuzzy numbers (clouds) We can also ask experts about confidence intervals for different probability levels (alpha-cuts, degree of membership)
Advantages of fuzzy sets description (clouds) • In order to define the worst case (intervals) we do not need many information • Confidence intervals can be defined for set valued data (random sets)
Dependency problem • It is not a good idea to convert interval probability density function to interval cumulative distribution function(overestimation problem)
Dependency problem P-box method consider all possible probability distribution i.e. some of them do not corresponds to any parameters a, b
Dependency problem Envelop does not correspond to any combination of parameters
- Risk for particular cost - Cumulative distribution function - vector of uncertain parameters
Advantages of Monte Carlo method • - it is possible to get full description of probability density function of the results • - the method is able to take into account any type of uncertainty and dependency
Computer implementation of the algorithm • Algorithm was implemented in C++ language. • GSL library was also applied.
Description of the node Node NumberOfNode 0, NumberOfChildren 2, Children 1 3, Probability 0.415, IntervalProbability 0.088, xMinMin 198.766, xMinMax 206.016, xMidMin215.688, xMidMax 219.313, xMaxMin 231.391, xMaxMax 238.641, ProbabilityGrids 3 NumberOfGrid 3 End