Download
1 / 24
240 likes | 377 Views
Moving from Global to Regional Projections of Climate Change Mat Collins College of Engineering, Mathematics and Physical Sciences, University of Exeter, UK Joint Met Office Chair in Climate Change. @ mat_collins. Long Term Climate Change: Projections, Commitments and Irreversibility.

E N D
Moving from Global to Regional Projections of Climate Change Mat Collins College of Engineering, Mathematics and Physical Sciences, University of Exeter, UK Joint Met Office Chair in Climate Change @mat_collins
Long Term Climate Change: Projections, Commitments and Irreversibility Mat Collins, RetoKnutti, Julie Arblaster, Jean-Louis Dufresne, Thierry Fichefet, Pierre Friedlingstein, XuejieGao, Bill Gutowski, Tim Johns, Gerhard Krinner, MxolisiShongwe, Claudia Tebaldi, Andrew Weaver, Michael Wehner
Global Mean Surface Air Temperature Change Anomalies w.r.t 1986-2005 average
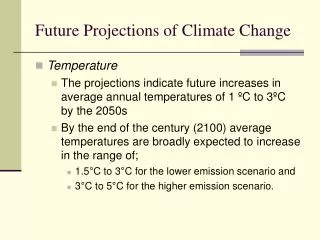
Global Temperature Assessment • The transient climate response is likely in the range of 1.0°C to 2.5°C (high confidence) and extremely unlikely greater than 3°C • The CMIP5 models coincide with this range • The RCPs are dominated by greenhouse gas forcing by the end of the century • Associate the 5-95% range of model simulations (+/- 1.64 standard deviations) with the likely range (66-100%) • Only valid for likely (66-100%) • Only valid for global mean temperature in long-term
Global Mean Surface Air Temperature Change likely = 66-100% probability 5-95% ~ ‘likely’ Assessing uncertainty and robustness in projections is much more that just counting CMIP models
Changes Conditional on Global Mean Temperature Rise • High northern latitudes expected to warm most • Land warms more than ocean surface • More hot and fewer cold extremes • Global mean precipitation increases but regional patterns of change not uniform • Contrast between wet and dry regions and seasons to increase (with regional exceptions) • Tropical atmospheric circulations expected to weaken, subtropics creep polewards • Arctic summer sea-ice to melt back – ice free conditions likely by mid century under RCP8.5 • Permafrost and snow cover to retreat • Atlantic Meridional Overturning Circulation (AMOC) to weaken but not collapse • N. Hemisphere storm track changes – low confidence
Cryosphere Solid lines – subset of models Shading – min/max Dotted – all CMIP5 models Requires the use of physical understanding in quantifying changes
How large is the projected change compared with internal variability? Stippling: changes are “large” compared with internal variability, and >90% of models agree on sign of change Stippling: changes are “large” compared with internal variability (greater than two standard deviations of internal variability), and at least 90% of models agree on sign of change RCP8.5 Hatching: changes are “small” compared with internal variability (less than one standard deviation of internal variability In projection maps hatchingindicates regions where the projected change issmallcompared to internal variability (less than one standard deviation of internal variability), and stipplingindicates regions where theprojected change is large compared to internal variability (greater than two standard deviations of internal variability), and where 90% of models agree on the sign of change. (Fig. SPM.7)
For Regional Surface Air Temperature Changes: • Mean pattern of change and its uncertainty is largely driven by ‘thermodynamic’ processes; global mean, land-sea contrast, polar amplification • We could build a quantitative theory of thermodynamic changes • Dynamical component • ‘Dynamical’ SAT changes seem much smaller – although of crucial importance in the tropics (e.g. Xie et al., 2010)
Changes Tropical Precip + Atmospheric Circulation ω=P/q P=ωq P≠ωq
Tropical Precipitation Changes: Chadwick et al., 2013 circulation changes moisture availability circulation weakening RH changes
For Regional Precipitation Changes: • Global mean changes are sub-Clausius-Clapeyron, constrained by tropospheric energy balance and lead to a weaker tropical circulation • Regionally the reduced circulation is largely balanced by moisture availability leaving other factors as important drivers of regional change; SST changes, land-sea contrast, land-surface feedbacks, … • Dynamics clearly important here – long time-scale coupling? • In mid-latitudes, precipitation increase is largely due to increased moisture availability with relatively unchanged storminess. Confidence in storminess projections is low
Chapter 14: Climate Phenomena and their Relevance for Future Regional Climate Change • El Niño-Southern Oscillation very likely remains as the dominant mode of interannual variability in the future and due to increased moisture availability, the associated precipitation variability on regional scales likely intensifies….. natural modulations of the variance and spatial pattern of El Niño-Southern Oscillation are so large in models that confidence in any specific projected change in its variability in the 21st century remains low.
Extreme El Niños Cai, Borlce, Lengaigne, van Rensch, Collins, Vecchi, Timmermann, Santoso, McPhaden, Wu, England, Guilyardi, Jin. Increasing frequency of extreme El Niño events due to greenhouse warming. Nature Climate Change, 2014
Changing El Niño Teleconnections Chung, Power, Arblaster, Rashid, Roff, Climate Dynamics, 2014 CMIP5 Power, Delange, Chung, Kociuba, Keay, Nature 2013 Atmosphere model simulations
Global Warming ‘Pause’ or ‘Hiatus’ Chapter 9, Box 9.2
Realization of internal variability from piControl Estimate of forced response from scenario ensemble mean = + Pseudo ensemble member Warming hiatus periods in CMIP5 control experiments Hiatus periods in piControl experiments identified by generation of pseudo ensembles Pseudo ensemble hiatus selection criteria: Period since 2001 with trend in global surface temperature ≤ 0.00 °C/yr Equivalent piControl hiatus selection criteria: 10 year period with trend in global surface temperature ≤ -0.16 °C/yr Methods 1/2 Chris Roberts, Matt Palmer, MO
CMIP5 historical + RCP4.5 pseudo ensembles Results 2/12 Chris Roberts, Matt Palmer, MO
Spatial trends in surface temperature during hiatus decades Results 5/12 Model hiatus decades shifted by + 0.16 °C/yr for comparison with observations
Trade Winds Strengthening England, McGregor, Spence, Meehl, Timmermann, Cai, Sen Gupta, McPhaden, Purich, Santoso, Nature Climate Change, 2014. See also Kosaka and Xie, 2013
Summary • Large-scale ‘thermodynamic’ response of temperature relatively well understood in terms of global + land/sea + polar amplification. Could build a quantitative theory • Global precipitation change understood in terms of energy balance and offset between weakening circulation and increase humidity • Regional precipitation in the tropics more determined by circulation changes and coupled(?) to ‘dynamical’ SST changes in tropics (RH contribution over tropical land) • Robust mid-latitude thermodynamic precipitation response but low confidence in dynamical features • Challenge is to combine information from imperfect models with our (sometimes quite good) understanding of physical processes