Download

1 / 42
440 likes | 574 Views
Learn about Repeated Measures ANOVA, Individual Differences, Logic, Effect Size, Post Hoc Tests, Assumptions, Two-Factor ANOVA, Main Effects, Interactions, and much more in this comprehensive PowerPoint lecture.

E N D
Chapter 14Repeated Measures andTwo Factor Analysis of Variance PowerPoint Lecture SlidesEssentials of Statistics for the Behavioral SciencesSeventh Editionby Frederick J. Gravetter and Larry B. Wallnau
Concepts to review • Independent-measures analysis of variance(Chapter 13) • Repeated measures designs (Chapter 11) • Individual differences
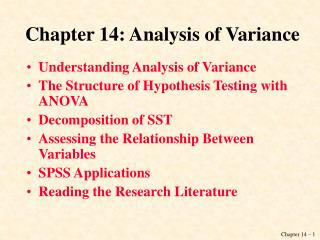
14.1 Overview • Analysis of Variance • Evaluated mean differences of two orgroups • Complex Analysis of Variance • Samples are related not independent(Repeated measures ANOVA) • More than one factor is tested(Factorial ANOVA, here Two-Factor)
14.2 Repeated Measures ANOVA • Advantages of repeated measures designs • Individual differences among participants do not influence outcomes • Smaller number of subjects needed to test all the treatments • Repeated Measures ANOVA • Compares two or more treatment conditions with the same subjects tested in all conditions • Studies same group of subjects at two or more different times.
Hypotheses for repeated measures ANOVA • Null hypothesis: in the population, there are no mean differences among the treatment groups • Alternate hypothesis states that there are mean differences among the treatment groups. H1: At least one treatment mean μis different from another
Individual Differences in the Repeated Measures ANOVA • F ratio based on variances • Same structure as independent measures • Variance due to individual differences is not present
Individual differences • Participant characteristics that vary from one person to another. • Not systematically present in any treatment group or by research design • Characteristics may influence measurements on the outcome variable • Eliminated from the numerator by the research design • Must be removed from the denominator statistically
Logic of repeated measures ANOVA • Numerator of the F ratio includes • Systematic differences caused by treatments • Unsystematic differences caused by random factors (reduced because same individuals in all treatments) • Denominator estimates variance reasonable to expect from unsystematic factors • Effect of individual differences is removed • Residual (error) variance remains
Figure 14.1 Structure of the Repeated-Measures ANOVA
Two Stages of the Repeated-Measures ANOVA • First stage • Identical to independent samples ANOVA • Compute SSTotal, SSBetween treatments and SSWithin treatments • Second stage • Removing the individual differences from the denominator • Compute SSBetween subjects and subtract it from SSWithin treatments to find SSError
Degrees of freedom for Repeated Measures ANOVA dftotal = N – 1 dfwithin treatments = Σdfinside each treatment dfbetween treatments =k – 1 dfbetween subjects = n – 1 dferror = dfwithin treatments – dfbetween subjects
Effect size for the Repeated-Measures ANOVA • Percentage of variance explained by the treatment differences • Partial η2 is percentage of variability that has not already been explained by other factors
Post hoc tests with Repeated Measures ANOVA • Determine exactly where significant differences exist among more than two treatment means • Tukey’s HSD and Scheffé can be used • Substitute SSerror and dferror in the formulas
Assumptions of the Repeated Measures ANOVA • The observations within each treatment condition must be independent. • The population distribution within each treatment must be normal. • The variances of the population distribution for each treatment should be equivalent.
Learning Check • A researcher obtains an F-ratio with df = 2, 12 from an ANOVA for a repeated-measures research study. How many subjects participated in the study?
Learning Check - Answer • A researcher obtains an F-ratio with df = 2, 12 from an ANOVA for a repeated-measures research study. How many subjects participated in the study?
Learning Check • Decide if each of the following statements is True or False.
14.2 Two-Factor ANOVA • Factorial designs • Consider more than one factor • Joint impact of factors is considered. • Three hypotheses tested by three F-ratios • Each tested with same basic F-ratio structure
Main effects • Mean differences among levels of one factor • Differences are tested for statistical significance • Each factor is evaluated independently of the other factor(s) in the study
Interactions between factors • The mean differences between individuals treatment conditions, or cells, are different from what would be predicted from the overall main effects of the factors • H0: There is no interaction between Factors A and B • H1: There is an interaction between Factors A and B
Interpreting Interactions • Dependence of factors • The effect of one factor depends on the level or value of the other • Non-parallel lines (cross or converge) in a graph • Indicate interaction is occurring • Typically called the A x B interaction
Figure 14.2 Graph of group means with and without interaction
Structure of the Two-Factor Analysis • Three distinct tests • Main effect of Factor A • Main effect of Factor B • Interaction of A and B • A separate F test is conducted for each
Two Stages of the Two-Factor Analysis of Variance • First stage • Identical to independent samples ANOVA • Compute SSTotal, SSBetween treatments and SSWithin treatments • Second stage • Partition the SSBetween treatments into three separate components, differences attributable to Factor A, to Factor B, and to the AxB interaction
Figure 14.3 Structure of the Two- Factor Analysis of Variance
Stage 2 of the Two Factor Analysis of Variance • This stage determines the numerators for the three F-ratios by partitioning SSbetween treatments
Degrees of freedom for Two-Factor ANOVA dftotal = N – 1 dfwithin treatments = Σdfinside each treatment dfbetween treatments =k – 1 dfA = number of rows – 1 dfB = number of columns– 1 dferror = dfwithin treatments – dfbetween subjects
Effect Size for Two-Factor ANOVA • η2, is computed as the percentage of variability not explained by other factors.
Figure 14.4 Sample means for Example 14.3
Assumptions for the Two-Factor ANOVA • The validity of the ANOVA presented in this chapter depends on three assumptions common to other hypothesis tests • The observations within each sample must be independent of each other • The populations from which the samples are selected must be normally distributed • The populations from which the samples are selected must have equal variances (homogeneity of variance)
Learning Check • If a two-factor analysis of variance produces a statistically significant interaction, then you can conclude that _____.
Learning Check - Answer • If a two-factor analysis of variance produces a statistically significant interaction, then you can conclude that _____.
Learning Check • Decide if each of the following statements is True or False.