Download
1 / 20
200 likes | 222 Views
Learn why effective inventory management is crucial for businesses. Discover significant costs related to inventory, key inventory models, management of inventory costs, and the concept of Economic Order Quantity (EOQ).

E N D
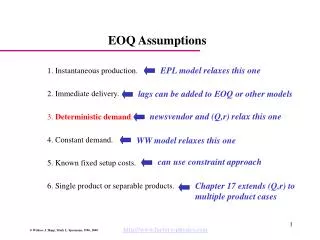
Why Do We Want Inventory • Improve customer service • Reduce certain costs such as • ordering costs • Stock out costs • acquisition costs • start-up quality costs • Contribute to the efficient and effective operation of the production system
Why We Do Not Want Inventory • Certain costs increase such as • carrying costs • cost of customer responsiveness • cost of coordinating production • cost of diluted return on investment • reduced-capacity costs • large-lot quality cost • cost of production problems
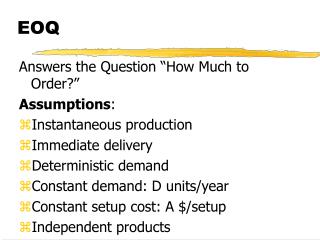
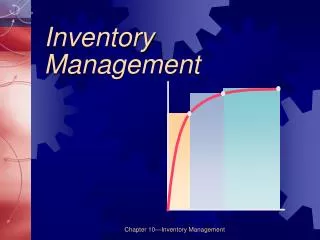
Inventory • Stock of items held to meet future demand • Inventory management answers two questions • How much to order • When to order
Inventory EOQ Models • Basic EOQ • EOQ for Production Lots • EOQ with Quantity Discounts
Inventory Costs • Carrying Cost • Cost of holding an item in inventory • Ordering Cost • Cost of replenishing inventory • Shortage Cost • Temporary or permanent loss of sales when demand cannot be met
2DCo Ch Q* = Basic EOQ Model Co - cost of placing order Ch - annual per-unit holding/carrying cost D - annual demand EOQ or Q*– economic order quantity
EOQ Costs • Annual carrying cost = (Q/2)Ch • Annual ordering cost = (D/Q)Co • Total cost (TC) = (Q/2)Ch + (D/Q)Co
2DCo Ch Q* = Carrying Cost = ChQ 2 CoD Q Ordering Cost = EOQ Cost Model Annual cost ($) Total Cost Minimum total cost Optimal order Q* Order Quantity, Q
EOQ: Economic Order Quantity • EOQ balances the cost of placing an order against the cost of storing product in inventory • The cost of storing a product in inventory can include warehouse costs, shipping costs, and cost of capital tied up in inventory • Notice that nowhere did the cost of the merchandise being sold enter into the equations • EOQ is vitally important in any retail business and most businesses where stocked items are managed
Safety Stocks • Safety stock • buffer added to on hand inventory during lead time • Stockout • an inventory shortage • Service level • probability that the inventory available during lead time will meet demand
Basis for setting the Reorder Point • During the lead time, customers continue to draw down the inventory • It is during this period that the inventory is vulnerable to stockout (run out of inventory) • Customer service level is the probability that a stockout will not occur during the lead time
Basis for setting the Reorder Point • Thus, the order point is set based on • the demand during lead time (DDLT) and • the desired customer service level • Reorder point (ROP) = Expected demand during lead time (EDDLT) + Safety stock (SS) • The amount of safety stock needed is based on the degree of uncertainty in the DDLT and the customer service level desired
Order quantity, Q Demand rate Inventory Level Reorder point, R 0 Time Lead time Lead time Order placed Order receipt Order placed Order receipt Ideal Inventory Order Cycle
Q Inventory level Reorder point, R 0 LT LT Time Variable Demand with a Reorder Point stockout
Q Inventory level Reorder point, R Safety Stock 0 LT LT Time Reorder Point with a Safety Stock
Calculating ROP • Reorder Point (ROP) = d x L - d = daily demand - L = lead time for delivery after an order With Safety Stock (SS) we get the following: ROP = d x L + SS
ROP Using Service Level • The customer service level is converted into a Z value using the normal distribution table • The safety stock is computed by multiplying the Z value by the std dev of DDLT. • The order point is set using ROP = EDDLT + SS, or by substitution • ROP = d x L + Z ( std dev D) D = demand during lead time
Using Discounts in EOQ • Under this condition, material cost becomes an incremental cost and must be considered in the determination of the EOQ • The total cost (TC) = material cost + ordering cost + carrying cost • TC = DC + (D/Q) Co + (Q/2)Ch D = annual demand in units C = cost per unit
2DCs Ch(1-d/p) Qp = EOQ for production: EPQ • D = annual demand in units • Qp = quantity produced in one batch • Cs = setup cost per setup • Ch = cost of holding or carrying • p = daily production rate • d = daily demand rate