Download

1 / 13
130 likes | 343 Views
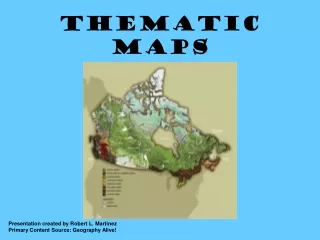
Geog 375 Individual Final Programming Project: Automated Thematic Maps. Courtney Runyan Spring 2017. Purpose.

E N D
Geog 375 Individual Final Programming Project: Automated Thematic Maps Courtney Runyan Spring 2017
Purpose The goal of this project was to take a time consuming task, creating a series of thematic maps with different themes, and automate it in a way that takes less time but still produces a finished map. To do this, the project cycles through each layer, then cycles through each smaller region in that layer, to publish a pdf file. Each finished map focuses on one small region and displaying one thematic variable.
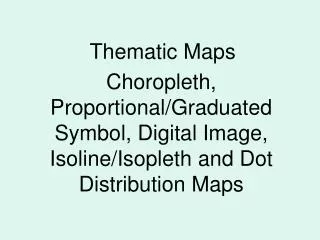
Data This example used census data at the block group level for California that was symbolized using three different thematic variables. The layers show population of children 5-17 per capita, the population of people aged 65 and over per capita, and the median age of people in the block group. Block groups where people do not reside were excluded from the dataset. Each map was limited to a single county using a counties layer.
Key Steps • Step 1: Defining the thematic layers, creating a “for loop.” • Step 2: Defining the layer variable, turning layer visibility on • Step 3: Using a search cursor to start another “for loop” • Step 4: Performing a definition query on the layer, zooming to extent • Step 5: Changing text for each map • Step 6: Publishing pdfs, the wrap-up
But First… Prior to coding, map document must be created from the chosen data: • Block group polygon layers are added to the map and symbolized according to a theme • Background information layers are arranged and labeled • Text elements (Title and subtitle) are included and named • Legend for each layer is created, stacked on top of each other, and turned on and off with layer.
Step 1: Defining the Thematic Layers, Creating a “for loop.” • Arcpy, sys, traceback module are imported • arcpy.mapping is imported • A few important variables are defined • A python list is created with thematic layer names (LayersToExport) • A “for loop” is created for each LayerName in the list LayersToExport • Required Variables: python list “LayersToExport”
Step 2: Defining the Layer, Turning Layer On • Continuing in the for loop, the program finds the correct layer with the ListLayers command, and assigns it to the variable “Layer” • Layer is turned on with the .visible command. • Effectively, this is like turning on a layer using the TOC in ArcMap • Required variables: mxd, dataframe
Step 3: The Search Cursor and Another “for loop” • A search cursor finds all attributes in the “NAME” field of the “counties” attribute table. • A sorted function is included in case of repeated attributes, so the same county isn’t processed twice. • Another for loop iterates through each county in the county name list. • Required variables: table, field The “counties” layer attribute table
Step 4: The Definition Query • Query statement is defined using the CTrows variable from the search cursor/sorted function • Current layer is queried to a single county using definition query • dataframe.extent and dataframe.scale zoom to that county, then pan back a bit Layer with definition query “NAME” = ‘Sacramento’
Step 5: Changing Text for Each Map • Variable tElements is defined as all text type layout elements using ListLayoutElements command • Map title is changed to LayerName (from original python list) • Map subtitle is changed to county name plus the year data was published • Required variables: mxd (used previously) Map title changed to layer name, subtitle to county name
Step 6: Publishing PDFs, the Wrap-Up • PDF folder and name specified using county name and layer name • ExportToPDF command publishes PDFs • Print statement tells you what layers and counties have been processed/published • Layer turned back off so next layer in list is visible • del mxd used to remove data lock Print statements
The Final Product • Folder of descriptively named PDFs created • Each PDF has a completed thematic map focused on one region and displaying one theme.
Conclusion • Code takes a just a few minutes to run, which is a huge decrease in time compared to doing all functions by hand, one by one • The program worked as intended, the few challenges that arose after the design phase were worked out through research and experimentation. • Though the final product is simple, it can be made more complex easily by changing more design elements, etc. Current program both stands on its own and can act as a basic structure for a larger product. • Using this program, maps can be not only quickly constructed, but quickly edited in large quantities when data is updated or needs changed.