Download
1 / 12
120 likes | 240 Views
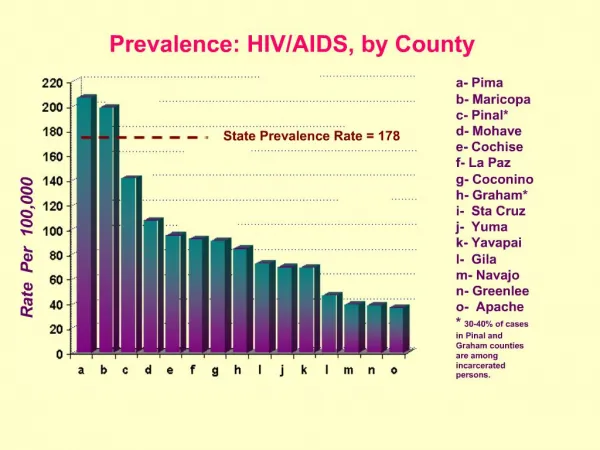
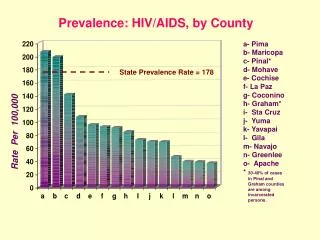
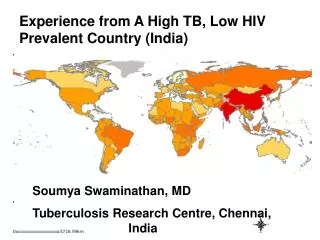
Adults Ages 15-49 with HIV. 15.01% - 34.0%. 5.01% - 15.0%. 1.01% - 5.0%. 0.51% - 1.0%. 0.0% - 0.5%. Not available. Map of HIV Prevalence Worldwide. 2005. Source: UNAIDS , 2006 Report on the Global AIDS Epidemic , 2006. People Living with HIV, by Region. Distribution, 2007.

E N D
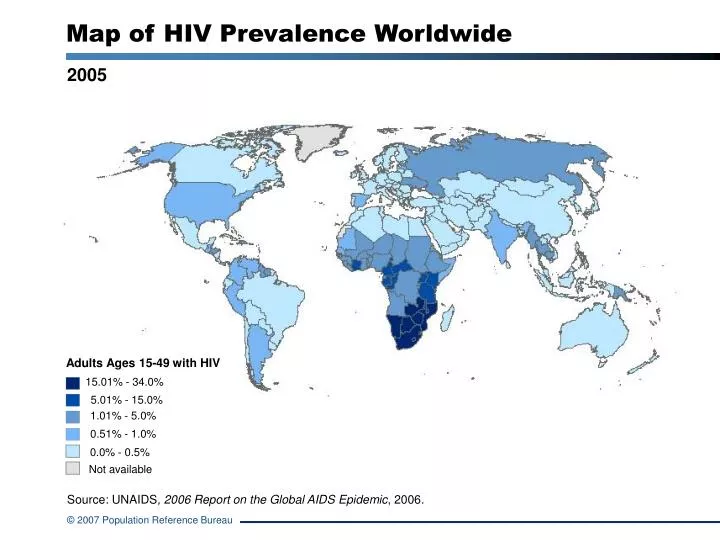
Adults Ages 15-49 with HIV 15.01% - 34.0% 5.01% - 15.0% 1.01% - 5.0% 0.51% - 1.0% 0.0% - 0.5% Not available Map of HIV Prevalence Worldwide 2005 Source: UNAIDS, 2006 Report on the Global AIDS Epidemic, 2006.
People Living with HIV, by Region Distribution, 2007 Note: Total exceeds 100 percent due to rounding. Source: UNAIDS, AIDS Epidemic Update, December 2007.
Notes on People Living with HIV, by Region In 2007, an estimated 33.2 million adults and children worldwide were living with HIV. Sixty-eight percent of the world’s HIV population lives in sub-Saharan Africa.
HIV Demographics, Africa Composition of the Population Living With HIV, 2007 Sub-Saharan Africa Rest of the world Source: UNAIDS, AIDS Epidemic Update, December 2007.
Notes on HIV Demographics, Africa • The proportion of people living with HIV who are adult women (ages 15 to 49) is 2.1 times higher in sub-Saharan Africa than in other regions. • In sub-Saharan Africa, where HIV is spread predominantly through heterosexual activity, women account for nearly two-thirds of the 22.5 million people living with HIV. In other regions, the average share of people living with HIV who are women drops to around one-sixth.
Effect of AIDS on Life Expectancy 2015-2020 Projections for Selected Countries Life expectancy at birth, in years Source: United Nations, World Population Prospects: The 2006 Revision, 2007.
Notes on Effect of AIDS on Life Expectancy 2015-2020 AIDS has reduced life expectancy in several countries around the world. In Lesotho, for example, without accounting for the impact of AIDS, life expectancy would have been 68 years; however, with AIDS, life expectancy has dropped to 46 years.
With AIDS WithoutAIDS AIDS’ Toll on Population Structure, South Africa Population Structure in 2020 Millions Age 80+ 75 70 65 60 55 50 45 40 35 30 25 20 15 10 5 0 Females Males Source: United Nations, World Population Prospects: The 2006 Revision (CD-ROM Edition—Extended Dataset), 2007.
South Africa’s Population With and Without AIDS Millions Source: United Nations, World Population Prospects: The 2006 Revision (CD-ROM Edition—Extended Dataset), 2007.
Effect of AIDS on Child Mortality Selected Countries in Sub-Saharan Africa, 2000-2005 Deaths of children under age 5 per 1,000 live births Source: UNAIDS and UNICEF, A Call to Action: Children, The Missing Face of AIDS, 2005; and United Nations, World Population Prospects: The 2006 Revision, 2007.
Increase in Children Orphaned By AIDS Sub-Saharan Africa Millions of children under age 18 Note: Estimate of children who lost at least one parent to an AIDS-related cause. Source: UNAIDS, UNICEF, and USAID, Children on the Brink 2004.
Children Orphaned by AIDS in Sub-Saharan Africa Distribution of Orphans, by Country, 2005 Source: UNAIDS, 2006 Report on the Global AIDS Epidemic, 2006.