Download
1 / 226
2.26k likes | 2.35k Views
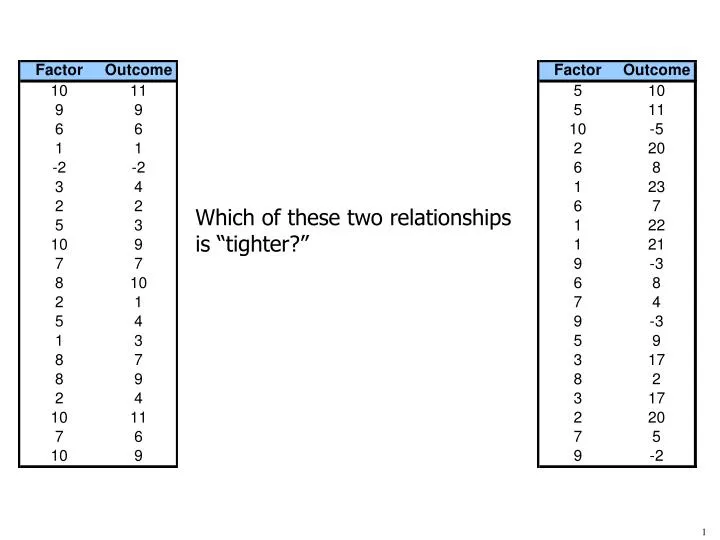
Which of these two relationships is “tighter?”. The relationship on the left appears “tighter” for three reasons:. Cognition bias . Simple linear relationships are easier to “eyeball” than complex relationships. Information bias . Rounding masks information.

E N D
The relationship on the left appears “tighter” for three reasons: • Cognition bias. Simple linear relationships are easier to “eyeball” than complex relationships. • Information bias. Rounding masks information. • Confirmation bias. Tendency to focus on observations that confirm beliefs and ignore observations that contradict beliefs.
Lesson #1 Never trust your eyes.
Corollary Don’t trust summary statistics either. Anscombe’s quartet Four data sets that yield identical summary statistics.
Lesson #1 Never trust your eyes. (Don’t trust summary statistics either) Lesson #2 Always employ sanity checks.
Mystery variable explains 57% of the variation in mortgage rates. Relationship is:
Mystery variable is Algeria’s GDP-relative-to-Trade Spurious Results An infinite number of factors can attempt to explain a given outcome. Look hard enough and you are guaranteed to find a perfect predictor. If the factor is “spurious,” what you are observing is random chance.
By random chance, the mystery variable predicts mortgage rates over this period. Mystery variable is Algeria’s GDP-relative-to-Trade.
If you wait long enough, randomness will tell you anything you want to hear. 100,000 letters DJIA will be down tomorrow! 25,000 letters . . . DJIA will be down tomorrow! 200,000 letters . . . 50,000 letters DJIA will be down tomorrow! DJIA will be down tomorrow! . . . DJIA will be down tomorrow! DJIA will be down tomorrow! . . . 100,000 letters DJIA will be down tomorrow! DJIA will be up tomorrow! 25,000 letters DJIA will be down tomorrow! . . . 200,000 letters DJIA will be up tomorrow! . . . DJIA will be up tomorrow! 50,000 letters DJIA will be up tomorrow! . . . DJIA will be up tomorrow! DJIA will be up tomorrow! . . . DJIA will be up tomorrow! DJIA will be up tomorrow!
Source: ftp.ngdc.noaa.gov/stp/solar_data/sunspot_numbers/yearlySource: ftp.ngdc.noaa.gov/stp/solar_data/sunspot_numbers/yearly www.senate.gov/pagelayout/history/one_item_and_teasers/partydiv.htm
Counter argument: Spurious or not, sunspots would have been useful at predicting Republicans in the Senate. Fallacy: We see the correlation in hindsight. To be useful, we need to detect the correlation before it ceases to exist.
1981 – 2005 1960 – 1980 Source: ftp.ngdc.noaa.gov/stp/solar_data/sunspot_numbers/yearly www.senate.gov/pagelayout/history/one_item_and_teasers/partydiv.htm
Lesson #1 Never trust your eyes. (Don’t trust summary statistics either) Lesson #2 Always employ sanity checks. Lesson #3 An observation is meaningless. Corollary An anecdote is both meaningless and dangerous.
Left half of room: Don’t look. Right half of room: Write what you read.
The average person in Benin earns an annual income of $750(in U.S. dollars).
Right half of room: Don’t look. Left half of room: Write what you read.
The average person in Andorra earns an annual income of $40,000 (in U.S. dollars).
The average person on planet Earth earns what annual income (in U.S. dollars)?
Anchoring When we see a piece of information, we evaluate subsequent information in light of the first piece of information. Information News interview of a single mother working three jobs to support her family. Policy Question Do we need welfare reform? Problem How common is this example?
Left half of room: Don’t look. Right half of room: Read and answer.
Should we require school districts to pay to install seat belts on school buses? 1 2 3 4 5 Definitely not! Absolutely!
Right half of room: Don’t look. Left half of room: Read and answer.
Every year in the U.S., 17,000 children are treated for injuries sustained in school buses accidents. Most of these injuries could have been avoided had the children been wearing seat belts. Should we require school districts to pay to install seat belts on school buses? 1 2 3 4 5 Definitely not! Absolutely!
Availability It’s easier to see what’s in front of us that it is to see what isn’t. Information News report showing the benefit of school bus seat belts. Policy Question Should we require seat belts in school buses? Problem What is the expected benefit and what are the tradeoffs?
Lesson #1 Never trust your eyes. Lesson #2 Always employ sanity checks. Lesson #3 An observation is meaningless. Corollary An anecdote is both meaningless and dangerous. Lesson #4 Not everything that appears random is.