Download
1 / 31
360 likes | 616 Views
THE INCLUSION PARADIGM The Key to Organizational Performance. Presented by Georgia Coffey Deputy Assistant Secretary for Diversity and Inclusion U.S. Department of Veterans Affairs. The Context & The Challenge.

E N D
THE INCLUSION PARADIGMThe Key to Organizational Performance Presented by Georgia Coffey Deputy Assistant Secretary for Diversity and Inclusion U.S. Department of Veterans Affairs
The Context & The Challenge Federal government is one of the most diverse environments in American society in terms of race, ethnicity, and gender (REG), yet we still have barriers to equal opportunity. Despite our diversity, we maintain a largely homogeneous mindset which creates barriers, cognitive dissonance, conflict, and flawed decision-making. Defining diversity solely in terms of REG has a detrimental effect.* To gain full acceptance, we must define diversity broadly to include all that makes us unique, including the diversity of thought. Only then will we realize the performance advantages that diversity offers. Diversity and inclusion must be the cornerstones of our talent management strategy and our business processes. Diversity without inclusion, will not work. * Stella M. Nkomo. “Identities and the Complexities of Diversity,” in Susan Jackson and Marian Ruderman (eds.), Diversity in Work Teams: Research Paradigms for a Changing Workplace, 1999
The Facts • By 2042, there will be no single demographic majority; people of color will comprise more than 50 percent of the U.S. population. • By 2050, 1 in 5 people living in the US will be Hispanic. • There are currently 4 generations in the workplace; soon to be 5. • Disabilities affect 20% of all Americans. • Women earn the majority of college degrees awarded in the United States. • There are an estimated 9 million LGBT individuals in the U.S. • 1 in 5 workers have experienced discrimination or unfair treatment at work. • < 50% of employees who experience discrimination will stay; attrition costs 150% of employees’ salary. • Inclusive organizations have the highest employee engagement, which in turn leads to higher performance and productivity. References: US Census Bureau; The Gallup Organization. Employee Discrimination in the Workplace, Public Opinion Poll. December 8, 2005; Sirota Survey.
Defining DiversityThe full spectrum of human differences and similarities, including immutable and mutable characteristics yielding unique perspectives. Reprinted with permission from Loden Associates..
Defining Inclusion Inclusion is the process of valuing all individuals and leveraging their diverse talent, not in spite of their differences, but because of them. Inclusion requires a conscious effort to involve all human resources in the fabric and mission of the organizations as a critical value add.
What does the research show? • Diversity Research Network • Workforce diversity is positively associated with higher business performance outcomes. • Racial diversity is positively associated with higher performance in organizations that integrate and leverage diverse perspectives. • Gender diversity is positively associated with more effective group processes and performance in organizations with (inclusive) people-oriented performance cultures.* • Center for Creative Leadership • Diverse teams are more creative and perform better in problem solving than homogeneous teams. • Diversity in workforce and processes results in better decision-making. • The effects of diversity are highly dependent on the presence of facilitating or inhibiting conditions in the organization; absent facilitating conditions (inclusion) the aforementioned outcomes are reversed. • Conclusion: Diversity without Inclusion will not work • * The Effects of Diversity on Business Performance: Report of the Diversity Research Network, October 2002.
The flip side… • UNC Business School • Workplace conflict results in 22-53% lost productivity. • EEOC • Average EEO complaint costs approximately $60,000 (administrative process) up to $250,000 (including settlement/damages). • 25-40% of workforce attrition rate and 5-20% in lost productivity can be attributed to poor diversity management; turnover costs 75-150% of the replaced employee’s salary. • Conclusion: There is a positive ROI for Diversity & Inclusion.
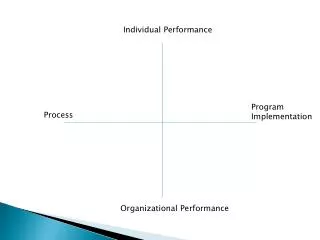
Systems that Influence Organizational Inclusion Changing an organizational culture requires re-engineering business processes and deconstructing silos. True inclusion will drive organizational performance Source: “From Diversity to Inclusion.” Katharine Esty, PhD. Northeast Human Resources Association. April 30, 2007
Current State of Government The Bureaucratic Model • Hierarchical • Chain of Command • Controlled Communications; need to know • Linear business processes • Self-reinforcing maintenance of status-quo • Convergent thinking and decision-making • “Heroic” Leadership and Accountability* *David Bradford and Allen Cohen, Power Up – Transforming Organizations through Shared Leadership. Wiley & Sons, New York, 1998.
Desired End State The Inclusive Model • Flattened organizations • Empowered contributors • Continual, transparent communications; knowledge is empowering • Matrix Management • Innovation and creativity rewarded • Divergent Thinking; open-ended decision process • Shared Leadership and Accountability* *David Bradford and Allen Cohen, Power Up – Transforming Organizations through Shared Leadership. Wiley & Sons, New York, 1998
How do we get there?Begin with Cultural Competence – Where are you on the continuum? POSITIVE Cultural Proficiency implements change to respond to cultural needs, do research and teach Cultural Competence recognize individual and cultural differences, seeks advice from diverse groups, hires unbiased staff Cultural Pre-competence explores cultural issues, are committed, assess needs of organization and individuals Cultural Blindness differences ignored, treats everyone the same, only responds to needs of dominant group • Cultural Incapacity: • racism, maintains stereotypes, unfair hiring practices NEGATIVE Cultural Destructiveness forced assimilation, subjugation, rights and privileges for dominant groups only
How do we get there? Business Process Reengineering Leadership Mindset: • Recognize your bias; Harvard Bias Impact Analysis Test • Challenge assumptions; reduce “confirmation bias” • Open mind to new, untested notions; consider alternative • Power and accountability must flow down; “flip the pyramid” • Sharing power does not= abdicating responsibility Business Processes: • Design processes to yield more than one solution • Use interdisciplinary teams; encourage divergent thought • De-construct silos; employ matrix management • Don’t fear creative tension; all constructive conflict • Align personnel rewards systems accordingly
How do we know we are there? The VA Diversity & Inclusion Indices Standardized metrics for – • workforce diversity • workplace inclusion • correlated with organizational performance Included in Monthly Performance review & EEO & Diversity Executive Dashboard
Diversity Index A measure of workforce diversity based on the convergence of the representation of each demographic group in the organization (by race, ethnicity, gender) with the relevant/civilian labor force (R/CLF). The Diversity Index is derived by the ratio of the workforce distribution to its corresponding R/CLF, up to a value of 100%. =
VA Diversity Index Sample Ratio of VA workforce representation to corresponding RCLF Capped at 1.0 or 100% Representation Indices capped at 100% (Blowup of previous chart with the ratio cap) Current (FY 2012, Dec) VA Diversity Index based on CLF = 87.44% Current (FY 2012, Dec) VA Diversity Index based on RCLF= 96.75% 91%
A Diversity Index FY 2003 to Dec 2012 (FY) vs. Civilian Labor Force (CLF) Prior to 2009 the Asian and Native Hawaiian and Pacific Islanders population were combined into a single category.
Federal Agency Diversity Index (Sample) Based on CLF
Inclusion Index • A measure of organizational inclusion based on Federal Employee Viewpoint Survey (FEVS) results. • FEVS items were directly linked to six empirically validated dimensions of inclusion, based on current research. Favorable responses (i.e. agree, strongly agree) on each survey item are computed and averaged.
Approach • In partnership with OPM, performed factor analysis of FEVS survey items which organized 59 out of 79 questions into 7 factors (clusters of items). • Factor Analysis is a statistical method that was used to cluster survey items into homogeneous sets to identify the most highly related survey items that measure the same or similar things. • Conducted review of research literature in the area of organizational inclusion to identify six empirically validated dimensions of inclusion (Shore 2011, Nishii 2010, April & Blass 2010). • Performed 2nd factor analysis to validate proposed dimensions of inclusion and identify the highest correlated/most appropriate items for each dimension.
DIMENSIONS OF INCLUSION • As a result of the SME content review and factor analyses, 20 FEVS items were mapped to the following six dimensions of inclusion: • Fairness of Employment Practices (Rules and Procedures) • Fairness of Employment Practices (Performance Evaluations) • Inclusion/Participation in Decision-Making • Inclusive Management and Leadership • Information Access/Open Communication • Integration of Differences
FEVS Items Mapped to Dimensions of Inclusion • Fairness of Employment Practices (Rules and Procedures) • Arbitrary action, personal favoritism and coersion for partisan political purposes are not tolerated. (#37) • Prohibited Personnel Practices are not tolerated. (#38) • Fairness of Employee Practices (Performance Evaluation) • In my work unit, steps are taken to deal with a poor performer who cannot or will not improve. (#23) • In my work unit, differences in performance are recognized in a meaningful way. (#24) • Awards in my work unit depend on how well employees perform their jobs. (#25) • Inclusion/Participation in Decision Making • I have enough information to do my job well. (#2) • I feel encouraged to come up with new and better ways of doing things. (#3) • My talents are used well in the workplace. (#1) • Employees have a feeling of personal empowerment with respect to work processes. (#30)
FEVS Items Mapped to Dimensions of Inclusion, cont. • Inclusive Management and Leadership • My supervisor supports my need to balance work and other life issues. (#42) • My supervisor/team leader provides me with constructive suggestions to improve my job performance. (#46) • My supervisor/team leader listens to what I have to say. (#48) • My supervisor/team leader treats me with respect. (#49) • In the last six months, my supervisor/team leader has talked with me about my performance. (#50) • Information Access and Communication • Managers promote communication among different work units. (#58) • Managers support collaboration across work units to accomplish work objectives. (#59) • Integration of Differences • Creativity and innovation are rewarded. (#32) • Policies and programs promote diversity in the workplace. (#34) • My supervisor/team leader is committed to a workforce representative of all segments of society. (#45) • Managers/supervisors/team leaders work well with employees of different backgrounds. (#55)
What’s on the horizon in VA? Inclusion strategies: • D&I infused Leadership Development Programs • Cultural Competency/Unconscious Bias Training • Conflict Management Training for mgrs & sups • Mentoring/coaching Programs • Diversity Focused internships: NDIP, SOAR • Intra- and Inter- agency Rotational Assignments • Targeted outreach & retention plans: HEOP • Mandatory Leadership Accountability Measures • NEW METRICS: VA Diversity & Inclusion Indices
LESSONS LEARNED • INTELLIGENCE COMMUNITY: Obstacles leading to 9/11 intelligence failures included: • Hardened attitudes against change • Insular organizations • Resistance to external recommendations • Insistence on preserving the status quo • SCIENTIFIC COMMUNITY: Causes that contributed to the Columbia shuttle accident included: • An organizational culture that squelched dissent and stifled differences • Resistance to external criticism and doubt • Imposition of the “party line vision…(which) led to flawed decision-making, self-deception, introversion, and diminished curiosity” • Organizational barriers that prevented open, effective communication • ECONOMIC COMMUNITY: Issues leading to Lehman Bros. bankruptcy and economic meltdown • Insular organization • Narrow decision-making; failure to gain broad input/perspective • Outmoded, embedded cultural habits; rigid, inflexible culture • Misuse of talent • “A culture that is too strong can also end up too rigid and can shut out diversity, especially diversity of perspective.” Hope Greenfield. “Culture Crash”, The Conference Board Review, Fall 2009.
What does this mean for Federal govt? • Diversity & Inclusion enhance performance and productivity; they are business, economic, and social imperatives. • Diversity should be broadly defined, including but not limited to legally protected groups; diversity of thought is rooted in our race, gender, and ethnicity. • Cultivate diversity of thought and constructive dissent; encourage dissent, not suppress it • Move away from insisting on consensus; move toward open debate and more diverse views • Align Diversity & Inclusion strategies with business goals and processes; inclusion is critical. • Intolerance to diversity breeds disastrous and costly results; agencies must first guarantee equity in the workplace before diversity and inclusion can thrive.
SYNERGY FOR AHIGH-PERFORMING ORGANIZATION High Performance Equity Workforce Diversity Organizational Inclusion
Presented by: Georgia Coffey Deputy Assistant Secretary for Diversity and Inclusion U.S. Department of Veterans Affairs Georgia.coffey@VA.Gov