Download
1 / 63
630 likes | 633 Views
This collection of lab activities covers topics such as natural selection, population genetics, comparing DNA, and diffusion & osmosis. Students will engage in hands-on experiments and data analysis to understand various concepts in biology.

E N D
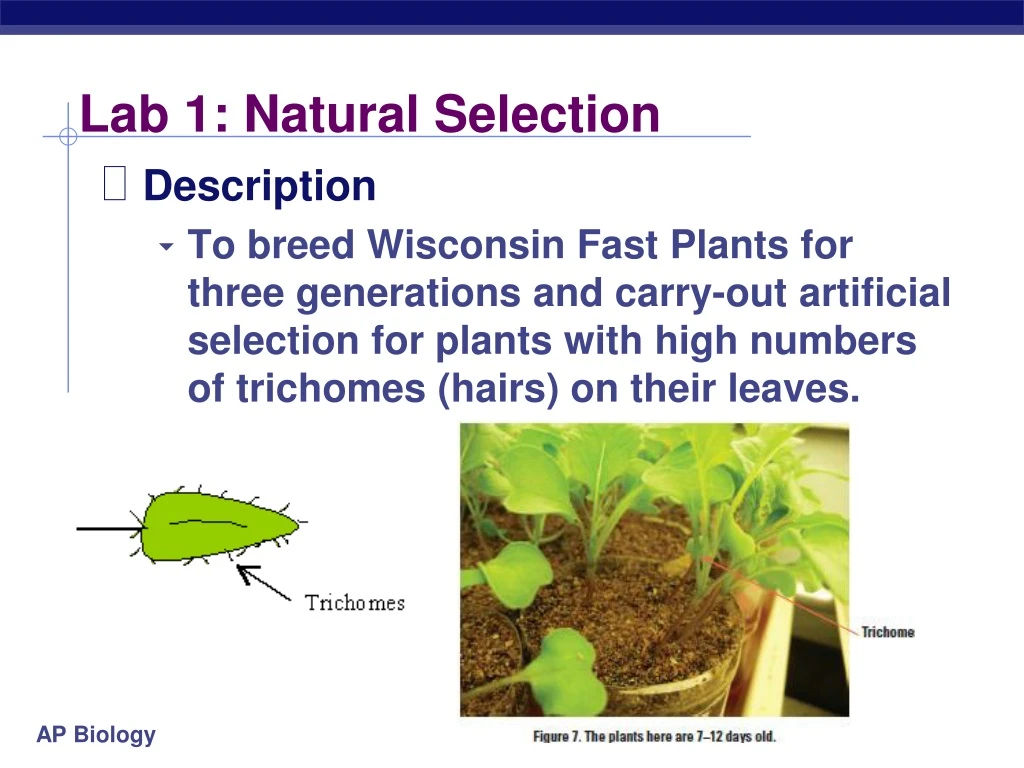
Lab 1: Natural Selection • Description • To breed Wisconsin Fast Plants for three generations and carry-out artificial selection for plants with high numbers of trichomes (hairs) on their leaves.
Lab 1: Natural Selection • Cross pollinate plants with the highest number of trichomes for three generations.
Lab 2: Population Genetics size of population & gene pool random vs. non-random mating
Lab 2: Population Genetics • Description • Students created an excel spreadsheet to look at allele frequencies changed over generations. • Students then were given different situations (i.e. selection, etc.) and asked to alter their spreadsheet to show how it changed the frequencies.
Lab 2: Population Genetics • Concepts • Hardy-Weinberg equilibrium • p + q = 1 • p2 + 2pq + q2 = 1 • required conditions • large population • random mating • no mutations • no natural selection • no migration • gene pool • heterozygous advantage • genetic drift • founder effect • bottleneck
Lab 2: Population Genetics • Conclusions • recessive alleles remain hidden in the pool of heterozygotes • even lethal recessive alleles are not completely removed from population • know how to solve H-W problems! • to calculate allele frequencies, use p + q = 1 • to calculate genotype frequencies or how many individuals, use, p2 + 2pq + q2 =1
Lab 2: Population Genetics • ESSAY 2008B-3 • Evolution is one of the unifying themes of biology. Evolution involves change in the frequencies of alleles in a population. For a particular genetic locus in a population, the frequency of the recessive allele (a) is 0.4 and the frequency of the dominant allele (A) is 0.6. • (a) What is the frequency of each genotype (AA, Aa, aa) in this population? What is the frequency of the dominant phenotype? • (b) How can the Hardy-Weinberg principle of genetic equilibrium be used to determine whether this population is evolving? • (c) Identify a particular environmental change and describe how it might alter allelic frequencies in this population. Explain which condition of the Hardy-Weinberg principle would not be met.
Lab 3: Comparing DNA Using BLAST • Description • Part I: draw a cladogram based on gene and protein similarities among four different species • Part II: BLAST to compare gene sequences from an “unknown” fossil to extant gene sequences. • placed that organism on a cladogram with known living organisms.
Lab 3: Comparing DNA Using BLAST • Concepts • Cladogram • Used to show evolutionary relationships between organisms • BLAST • NCBI • Compare genetic sequences
Lab 3: Comparing DNA Using BLAST • ESSAY 2009 • Phylogeny is the evolutionary history of a species. • (a) The evolution of a species is dependent on changes in the genome of the species. Identify TWO mechanisms of genetic change, and explain how each affects genetic variation. • (b) Based on the data in the table below, draw a phylogenetic tree that reflects the evolutionary relationships of the organisms based on the differences in their cytochrome c amino-acid sequences and explain the relationships of the organisms. Based on the data, identify which organism is most closely related to the chicken and explain your choice. • (c) Describe TWO types of evidence—other than the comparison of proteins—that can be used to determine the phylogeny of organisms. Discuss one strength of each type of evidence you described. THE NUMBER OF AMINO ACID DIFFERENCES IN CYTOCHROME c AMONG VARIOUS ORGANISMS
Lab 4: Diffusion & Osmosis • Surface area/Volume ratio • V = L x W x H (s3) • SA of a cube = L x W x # of sides • Potato Cores • potato cores in sucrose solutions • determining solute concentration of the potato
Lab 4: Diffusion & Osmosis • Concepts • semi-permeable membrane • diffusion • osmosis • solutions • hypotonic • hypertonic • isotonic • water potential
Lab 4: Diffusion & Osmosis • Conclusions • water moves from high concentration of water (hypotonic=low solute) to low concentration of water (hypertonic=high solute) • solute concentration & size of molecule affect movement through semi-permeable membrane
Lab 4: Diffusion & Osmosis ESSAY 1992 A laboratory assistant prepared solutions of 0.8 M, 0.6 M, 0.4 M, and 0.2 M sucrose, but forgot to label them. After realizing the error, the assistant randomly labeled the flasks containing these four unknown solutions as flask A, flask B, flask C, and flask D. Design an experiment, based on the principles of diffusion and osmosis, that the assistant could use to determine which of the flasks contains each of the four unknown solutions. Include in your answer: • a description of how you would set up and perform the experiment; • the results you would expect from your experiment; and • an explanation of those results based on the principles involved. Be sure to clearly state the principles addressed in your discussion.
Lab 5: Photosynthesis • Description • Spinach cut out disks were placed in two different syringes (bicarbonate and without) • photosynthetic rate was calculated by measuring the number that floated over time. • Students then designed their own experiment to see what factors affected photosynthesis.
Lab 5: Photosynthesis • Concepts • Photosynthesis • ET50 = the point at which 50% of the leaf disks are floating • inverse relationship between rate and ET50 • Should have graphed 1/ET50 in this lab. • experimental design • IV: presence of bicarbonate • DV: number of disks floating
Lab 5: Photosynthesis • ESSAY 1999-1: • The rate of photosynthesis may vary with changes that occur in environmental temperature, wavelength of light, and light intensity. Using a photosynthetic organism of your choice, choose only ONE of the three variables (temperature, wavelength of light, or light intensity) and for this variable • design a scientific experiment to determine the effect of the variable on the rate of photosynthesis for the organism; • explain how you would measure the rate of photosynthesis in your experiment;
Lab 6: Cellular Respiration • Description • using respirometer to measure rate of O2 production by pea seeds • non-germinating peas • germinating peas • effect of temperature • control for changes in pressure & temperature in room
Lab 6: Cellular Respiration • Concepts • respiration • experimental design • control vs. experimental • function of KOH • function of vial with only glass beads
Lab 6: Cellular Respiration • Conclusions • temp = respiration • germination = respiration calculate rate?
Lab 6: Cellular Respiration ESSAY 1990 The results below are measurements of cumulative oxygen consumption by germinating and dry seeds. Gas volume measurements were corrected for changes in temperature and pressure. a. Plot the results for the germinating seeds at 22°C and 10°C. b. Calculate the rate of oxygen consumption for the germinating seeds at 22°C, using the time interval between 10 and 20 minutes. c. Account for the differences in oxygen consumption observed between: 1. germinating seeds at 22°C and at 10°C 2. germinating seeds and dry seeds. d. Describe the essential features of an experimental apparatus that could be used to measure oxygen consumption by a small organism. Explain why each of these features is necessary.
I P M A T Lab 7: Mitosis & Meiosis • Concepts • mitosis • interphase • prophase • metaphase • anaphase • telophase • meiosis • meiosis 1 • separate homologous pairs • meiosis 2 • separate sister chromatids • crossing over • in prophase 1
Lab 7: Mitosis & Meiosis • Description • crossing over in meiosis • farther gene is from centromere the greater number of crossovers • observed crossing over in fungus, Sordaria • arrangement of ascospores
total crossover % crossover = total offspring % crossover distance fromcentromere = 2 Sordaria analysis
Lab 7: Mitosis & Meiosis • Conclusions • Mitosis • cell division • growth, repair • making clones • longest phase = interphase • each subsequent phase is shorter in duration • Meiosis • reduction division • making gametes • increasing variation • crossing over in Prophase 1
Lab 7: Mitosis & Meiosis ESSAY 1987 Discuss the process of cell division in animals. Include a description of mitosis and cytokinesis, and of the other phases of the cell cycle. Do not include meiosis. ESSAY 2004 Meiosis reduces chromosome number and rearranges genetic information. a. Explain how the reduction and rearrangement are accomplished in meiosis. b. Several human disorders occur as a result of defects in the meiotic process. Identify ONE such chromosomal abnormality; what effects does it have on the phenotype of people with the disorder? Describe how this abnormality could result from a defect in meiosis. c. Production of offspring by parthenogenesis or cloning bypasses the typical meiotic process. Describe either parthenogenesis or cloning and compare the genomes of the offspring with those of the parents.
Lab 8: Molecular Biology • Description • Transformation • insert foreign gene in bacteria by using engineered plasmid • also insert ampicillin resistant gene on same plasmid as selectable marker
Lab 8: Molecular Biology • Concepts • transformation • plasmid • selectable marker • ampicillin resistance • restriction enzyme
Lab 8: Transformation • Conclusions • can insert foreign DNA using vector • ampicillin becomes selecting agent • no transformation = no growth on amp+ plate
Lab 8: Molecular Biology ESSAY 2002 The human genome illustrates both continuity and change. • Describe the essential features of two of the procedures/techniques below. For each of the procedures/techniques you describe, explain how its application contributes to understanding genetics. • The use of a bacterial plasmid to clone and sequence a human gene • Polymerase chain reaction (PCR) • Restriction fragment polymorphism (RFLP analysis) • All humans are nearly identical genetically in coding sequences and have many proteins that are identical in structure and function. Nevertheless, each human has a unique DNA fingerprint. Explain this apparent contradiction.
Lab 9: Molecular Biology • Gel electrophoresis • cut DNA with restriction enzyme • fragments separate on gel based on size • A cancer patient was tested to see if the DNA from her breast, blood, surrounding tissue and a control group. • How would you know?
Lab 9: Molecular Biology • Concepts • restriction enzyme • gel electrophoresis • DNA is negatively charged • smaller fragments travel faster
Lab 9: Gel Electrophoresis • Conclusions DNA = negatively charged correlate distance to size smaller fragments travel faster & therefore farther
Lab 9: Molecular Biology ESSAY 1995 The diagram below shows a segment of DNA with a total length of 4,900 base pairs. The arrows indicate reaction sites for two restriction enzymes (enzyme X and enzyme Y). • Explain how the principles of gel electrophoresis allow for the separation of DNA fragments • Describe the results you would expect from electrophoretic separation of fragments from the following treatments of the DNA segment above. Assume that the digestion occurred under appropriate conditions and went to completion. • DNA digested with only enzyme X • DNA digested with only enzyme Y • DNA digested with enzyme X and enzyme Y combined • Undigested DNA • Explain both of the following: • The mechanism of action of restriction enzymes • The different results you would expect if a mutation occurred at the recognition site for enzyme Y.
Lab 10: Energy Dynamics • Description • Part I: Net primary productivity of Fast Plants- • Data was given on fast plants that were grown over 14 days. • Dry mass was divided by wet mass to obtain biomass. • Bio mass was multiplied by 4.35 kcal to obtain net primary productivity per 10 plants and divided by 10 to get NPP per day per plant.
Lab 10: Energy Dynamics • Description • Energy flow between plants and butterfly larvae • brussel sprouts and caterpillars were massed before and after 3 days of caterpillar consumption. • Biomass (dry/wet) and energy constant were used to calculate how much energy from plant was used in cell respiration and how much was lost as water. • PLANT ENERGY CONSUMED PER INDVIDUAL • ENERGY PRODUCTION PER INDIVDUAL • FRASS ENERGY (energy lost in feces) • RESPIRATION ESTIMATE
Lab 11: Transpiration • Description • Part I: Determine the rate of transpiration using a potometer. • Then test a variable: - temperature - humidity - air flow (wind) - light intensity • Part II: Determine the surface area of the leaf and average stomata per square millimeter.
Lab 11: Transpiration • Concepts • transpiration • stomates • guard cells • xylem • adhesion • cohesion • H bonding
Lab 11: Transpiration • Conclusions • transpiration • wind • light • transpiration • humidity
Lab 11: Transpiration ESSAY 1991 A group of students designed an experiment to measure transpiration rates in a particular species of herbaceous plant. Plants were divided into four groups and were exposed to the following conditions. Group I: Room conditions (light, low humidity, 20°C, little air movement.) Group II: Room conditions with increased humidity. Group III: Room conditions with increased air movement (fan) Group IV: Room conditions with additional light The cumulative water loss due to transpiration of water from each plant was measured at 10-minute intervals for 30 minutes. Water loss was expressed as milliliters of water per square centimeter of leaf surface area. The data for all plants in Group I (room conditions) were averaged. The average cumulative water loss by the plants in Group I is presented in the table below. • Construct and label a graph using the data for Group I. Using the same set of axes, draw and label three additional lines representing the results that you would predict for Groups II, III, and IV. • Explain how biological and physical processes are responsible for the difference between each of your predictions and the data for Group I. • Explain how the concept of water potential is used to account for the movement of water from the plant stem to the atmosphere during transpiration.
Lab 12: Animal Behavior • Description • set up an experiment to study behavior in an organism • pillbug kinesis
Lab 12: Animal Behavior • Concepts • innate vs. learned behavior • experimental design • control vs. experimental • hypothesis • which factors affect pill bug behavior and taxis. • choice chamber • temperature • surface texture • light intensity • acidity
Lab 12: Animal Behavior • Hypothesis development • Poor:I think pillbugs will move toward the wet side of a choice chamber. • Better:If pillbugs prefer a moist environment, then when they are randomly placed on both sides of a wet/dry choice chamber and allowed to move about freely for 10 minutes, most will be found on the wet side.
Lab 12: Animal Behavior • Experimental design sample size
Lab 12: Animal Behavior ESSAY 1997 A scientist working with Bursatella leachii, a sea slug that lives in an intertidal habitat in the coastal waters of Puerto Rico, gathered the following information about the distribution of the sea slugs within a ten-meter square plot over a 10-day period. a. For the data above, provide information on each of the following: • Summarize the pattern. • Identify three physiological or environmental variables that could cause the slugs to vary their distance from each other. • Explain how each variable could bring about the observed pattern of distribution. b. Choose one of the variables that you identified and design a controlled experiment to test your hypothetical explanation. Describe results that would support or refute your hypothesis.
Lab 12: Animal Behavior ESSAY 2002 The activities of organisms change at regular time intervals. These changes are called biological rhythms. The graph depicts the activity cycle over a 48-hour period for a fictional group of mammals called pointy-eared bombats, found on an isolated island in the temperate zone. • Describe the cycle of activity for the bombats. Discuss how three of the following factors might affect the physiology and/or behavior of the bombats to result in this pattern of activity. • temperature • food availability • presence of predators • social behavior • Propose a hypothesis regarding the effect of light on the cycle of activity in bombats. Describe a controlled experiment that could be performed to test this hypothesis, and the results you would expect.