Download
1 / 8
90 likes | 270 Views
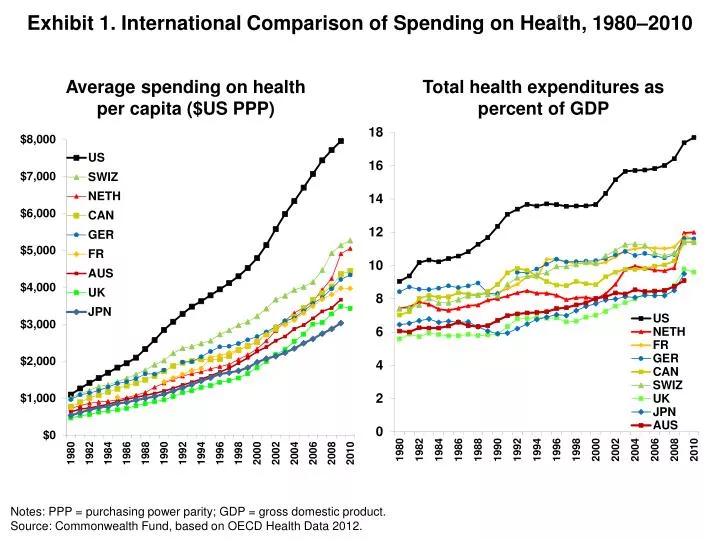
Exhibit 1 . International Comparison of Spending on Health, 1980–2010. Average spending on health per capita ($US PPP). Total health expenditures as percent of GDP. Notes: PPP = purchasing power parity; GDP = gross domestic product.

E N D
Exhibit 1. International Comparison of Spending on Health, 1980–2010 Average spending on healthper capita ($US PPP) Total health expenditures aspercent of GDP Notes: PPP = purchasing power parity; GDP = gross domestic product. Source: Commonwealth Fund, based on OECD Health Data 2012.
Exhibit 2. Projected U.S. National Health Expenditures (NHE) by Source, 2013–2023 NHE in $ billions % GDP: 17.9%18.7%20.5% Note: GDP = gross domestic product. Source: Estimates by Actuarial Research Corporation for The Commonwealth Fund.
Exhibit 3. Medicare Spending per Enrollee Projected to Increase More Slowly Than Private Insurance Spending per Enrollee and GDP per Capita Annual rate of growth (percent) Note: GDP = gross domestic product. Source: CMS Office of the Actuary, National Health Expenditure Projections, 2011–2021, updated June 2012.
Exhibit 4. Rising Health Spending Crowds Out Other Priorities Massachusetts State Budget, FY 2001 vs. FY 2011 State spending ($ billions) FY2001 FY2011 +$5.1 B (+59%) -$4.0 B (-20%) -15% -13% -11% -23% -50% -33% -38% Health care coverage(state employees/GIC; Medicaid/health reform) Publichealth Mentalhealth Educa-tion Infra-struc-ture/housing Humanservices Localaid Publicsafety Note: GIC = Group Insurance Commission. Source: Massachusetts Budget and Policy Center Budget Browser.
Exhibit 5. Premiums Rising Faster Than Inflation and Wages Cumulative changes in insurance premiums and workers’ earnings, 1999–2012 Projected average family premium as a percentage of median family income, 2013–2021 Percent Percent 180% 172% 47% 38% Projected Sources: (left) Kaiser Family Foundation/Health Research and Educational Trust, Employer Health Benefits Annual Surveys, 1999–2012; (right) author’s estimates based on CPS ASEC 2001–12, Kaiser/HRET 2001–12, CMS OACT 2012–21.
Exhibit 6. Cumulative Impact of Comprehensive Strategy on Health Spending, 2013–2023: Medicare, Federal, and NHE Net impact in $ billions Note: NHE = national health expenditures. Components may not add to total because of rounding. Source: Estimates by Actuarial Research Corporation for The Commonwealth Fund.
Exhibit 7. Cumulative Impact of Comprehensive Strategy on Health Spending, 2013–2023, by Payer Net impact in billions Note: NHE = national health expenditures. Components may not add to total because of rounding. Source: Estimates by Actuarial Research Corporation for The Commonwealth Fund.
Exhibit 8. Projected National Health Expenditures (NHE), 2013–2023: Potential Impact of Synergistic Strategy NHE in $ trillions Note: GDP = gross domestic product. Source: Estimates by Actuarial Research Corporation for The Commonwealth Fund. Current baseline projection assumes that the cuts to Medicare physician fees under the sustainable growth rate (SGR) formula are repealed and basic physician fees are instead increased by 1% in 2013 and held constant from 2014 through 2023.