Download
1 / 30
300 likes | 374 Views
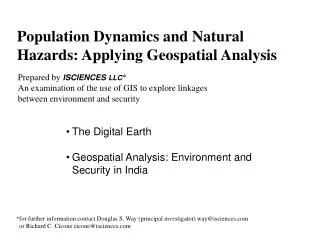
Applying Statistical Analysis on Geospatial Natural Hazard Raster Data. Jason Catelli MGIS Candidate GEOG 596A Dr. Patrick Kennelly – Advisor May 8, 2014. Presentation Overview. Background General Data Project Statistics What has been done ? Objective Methodology Timeline

E N D
Applying Statistical Analysis on Geospatial Natural HazardRaster Data Jason Catelli MGIS Candidate GEOG 596A Dr. Patrick Kennelly – Advisor May 8, 2014
Presentation Overview • Background • General • Data • Project • Statistics • What has been done? • Objective • Methodology • Timeline • Future Adaptations
Background: General • 2011 Lower Mississippi River Flooding • Arkansas, Illinois, Kentucky, Louisiana, Mississippi, Missouri, and Tennessee • 21,000 homes and businesses impacted • Damaged many levee systems • ~ $3 Billion in damages • 2011 Virginia Earthquake • 5.8 Magnitude • Felt across the East Coast • Largest east of the Rockies since 1897 • 2012 Superstorm Sandy • Westward “Right-turn” path • Lowest barometric pressure ever recorded for an Atlantic storm to make landfall north of Cape Hatteras, NC (940mb) • Extreme storm surge • 13.88 feet at Battery Park in NYC • 32.5 foot wave measured by buoy in New York Harbor
Background: General • Return periods or recurrence intervals • The % chance of exceeding a certain threshold over 1 year • 100-yr flood event is a 1 in 100 chance or 1% chance over 1 year • 500-yr magnitude earthquake is a 1 in 500 chance or 0.2% chance over 1 year • 1000-yr storm surge flooding refers to 1 in 1000 chance or 0.1% chance over 1 year • How are these numbers used? • Insurance companies and public entities use return periods to understand the risk and prepare for catastrophic extremes • Policies and pricing can be set based on the chance of events with respect to a geographic region • Catastrophe models simulate events and can produce return periods based on historical and simulated results • Protection structures are built to heights based on values of a particular return period
Background: General • So how rare were these events? • 2011 Lower Mississippi River Flooding • ~75-200-yr event (AIR Worldwide, 2011) • 2011 Virginia Earthquake • 1000-1300-yr event (Chapman, 2012) • 2012 Superstorm Sandy • Westward “Right-turn” path (Hall, 2013) • 700-yr event • Extreme storm surge (Sweet, 2013) • ~300-yr Sandy Hook, NJ • ~1500-yr The Battery, Lower Manhattan
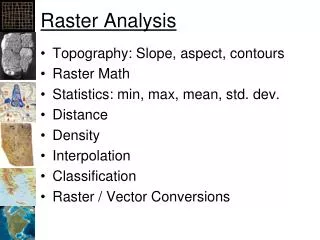
Background: Data • Natural hazard analysis is typically best implemented using gridded data • Data is usually natively in a raster format • Uniform point data can be easily converted to grid data • Point data can be interpolated to a grid • Many overlay functions are simple to perform using raster data • Utilizing Map Algebra • Concept is very similar to mathematical algebra • Operators and functions can be applied to grid values to produce new values (raster grids) • Performed on individual or collection of rasters
Background: Data • Types of raster analysis • Local – works on a cell by cell basis • Focal (neighborhood) – uses surrounding cells • Zonal – uses defined zone input layer • (Albrecht, 2007, p. 57)
Background: Project • US Gulf and East Coast storm surge dataset development • Goal of project to create two raster datasets representing 100-yr and 500-yr storm surge flood elevations • Current process involves simulating thousands of synthetic storm surge events across the project area utilizing SLOSH (Sea, Lake, and Overland Surges from Hurricanes) model data • Based on results derived from the SLOSH model, a series of interpolations were performed at both the SLOSH basin level as well as the event level • Final result for each event consists of several rasters representing two iterations of interpolations along with their respective variance • All results tied to a project-wide raster with unique cell IDs
Background: Project SLOSH Basin Coverage (NOAA)
Background: Project • US Gulf and East Coast storm surge dataset development • Goal of project to create two raster datasets representing 100-yr and 500-yr storm surge flood elevations • Current process involves simulating thousands of synthetic storm surge events across the project area utilizing SLOSH (Sea, Lake, and Overland Surges from Hurricanes) model data • Based on results derived from the SLOSH model, a series of interpolations were performed at both the SLOSH basin level as well as the event level • Final result for each event consists of several rasters representing two iterations of interpolations along with their respective variance • All results tied to a project-wide raster with unique cell IDs
Background: Project Interpolation at SLOSH Basin level
Background: Project Interpolation at Event level
Background: Project • US Gulf and East Coast storm surge dataset development • Goal of project to create two raster datasets representing 100-yr and 500-yr storm surge flood elevations • Current process involves simulating thousands of synthetic storm surge events across the project area utilizing SLOSH (Sea, Lake, and Overland Surges from Hurricanes) model data • Based on results derived from the SLOSH model, a series of interpolations were performed at both the SLOSH basin level as well as the event level • Final result for each event consists of several rasters representing two iterations of interpolations along with their respective variance • All results tied to a project-wide raster with unique cell IDs
Background: Project Project Grid
Background: Project • US Gulf and East Coast storm surge dataset development (continued) • Process written in Python and utilizes Arc Advanced, Spatial Analyst, and Geostatistical Analyst. • Entire project to this point (with the exception of the SLOSH work) has been accomplished utilizing GIS • Final code output places the results for each event into a text file with cell ID on global grid and corresponding values • Current plan is for a colleague to create a code to read each event text file and for each project-wide grid cell determine each participating event for that cell and value • Final goal to then apply extreme value theory to determine 100-yr and 500-yr values for each cell within global grid
Background: Statistics • Extreme Value Theory • “Techniques and models for describing the unusual rather than the usual” (Coles, 2001, p. vii) • Goal of EVT to quantify stochastic or random behavior of processes or phenomena at a very large or very small scale • Involves predicting extreme values beyond what has already been observed • Levee example – determine the height to build to for 500-yr protection
Background: Statistics Extreme Value Theory - Block Maxima/Minima Technique • Divide data into equal sized time intervals/blocks (i.e. by month) • Determine the maximum value for each block • Estimate Generalized Extreme Value (GEV) distribution fitted to block maxima • Calculate return value function and uncertainty https://www.isse.ucar.edu/extremevalues/back.html
Background: Statistics Extreme Value Theory - Peak Over Threshold Technique • Select a threshold • Extract exceedances from data • Fit exceedances to General Pareto (GP) Distribution (conditional distribution) • Estimate unconditional distribution and return values https://www.isse.ucar.edu/extremevalues/back.html
What has already been done? • Risk Assessment of Hurricane Storm Surge for New York City (Lin et al., 2010) • Simulated large number of synthetic hurricane events • Storm surge values based on SLOSH model data • Used peaks-over-threshold method with the generalized Pareto distribution to generate return periods
What has already been done? • Drought Risk Assessment (Tonini, 2013) • Used extreme value analysis to calculate maximum monthly temperatures contributing to drought conditions • GIS-based analysis • Custom Python script and toolbox created utilizing calls to R statistical package • Block maxima technique only
Objective • To apply statistical analysis to geospatial raster data to calculate values for desired return periods on natural hazard data. • How will this be achieved? • Explore existing methodologies to determine which (if any) techniques would fit current project • Formulate a series of methods to perform statistical analysis on geospatial raster data in an advanced statistical package utilizing the Python programming language.
Methodology • Evaluate current code • Move rasters to array structures utilizing SciPy’s NumPy library • Evaluate functions offered by SciPy • Evaluate functions offered by outside statistical packages as pertains to extreme value theory • Develop new code to connect array structure to statistics offered by SciPy and/or through an outside statistical package • Produce sample output and compare to results derived by colleague’s process
Methodology • SciPy - www.scipy.org • Python-based open-source software for mathematics, science, and engineering • NumPy library – fundamental library for numerical computing • Numerical (multi-dimensional) arrays and matrix types • Key piece to the project – moving raster data out of ArcGIS into this format for optimized processing • RasterToNumPyArray / NumPyArrayToRaster • SciPy.stats • Large number of probability distributions • Library of statistical functions
Methodology • Evaluate current code • Move rasters to array structures utilizing SciPy’s NumPy library • Evaluate functions offered by SciPy • Evaluate functions offered by outside statistical packages as pertains to extreme value theory • Develop new code to connect array structure to statistics offered by SciPy and/or through an outside statistical package • Produce sample output and compare to results derived by colleague’s process
Methodology • R - http://www.r-project.org/ • Free software environment for statistical computing and graphics • Wide variety of statistical and graphical techniques • Highly extensible • Contains suite of operators to perform calculations on arrays and matrices • Large collection of intermediate tools for data analysis • Well developed, simple, programming language
Methodology • Evaluate current code • Move rasters to array structures utilizing SciPy’s NumPy library • Evaluate functions offered by SciPy • Evaluate functions offered by outside statistical packages as pertains to extreme value theory • Develop new code to connect array structure to statistics offered by SciPy and/or through an outside statistical package • Produce sample output and compare to results derived by colleague’s process
Timeline • Summer 2014 • Research • Evaluate current code • Investigate SciPy and utilization of NumPy arrays • Investigate outside statistical packages • Determine connection between Python and statistical packages • Code Changes • Fall 2014 • Code improvements • Complete report • Late Fall 2014/ Spring 2015 • American Geophysical Union Conference? • American Association of Geographers Conference?
Future Adaptations • Utilizing Extreme Value Theory for other hazards • Flood modeling • Wind events • Earthquakes • Additional statistical analysis beyond Extreme Value Theory • Ability to move from ArcGIS to outside statistical package • Utilization of SciPy to improve code performance by tapping into multi-dimensional arrays
Acknowledgements Dr. Patrick Kennelly - Advisor Dr. ShangyaoNong - Colleague
Sources • AIR Worldwide. “Alert Worldwide: Mississippi River Flooding.” Last modified May 13, 2011. http://alert.air-worldwide.com/EventSummary.aspx?e=554&tp=54&c=1. • Albrecht, Jochen. Key Concepts and Techniques in GIS. London: SAGE Publications Ltd., 2007. • Chang, Kang-Tsung. Introduction to Geographic Information Systems. Texas: McGraw-Hill, 2003. • Coles, Stuart. An Introduction to Statistical Modeling of Extreme Values. London: Springer-Verlag, 2001. • Chapman, Martin. “The August 23, 2011 Earthquake in the Central Virginia Seismic Zone.” Presentation at the USGS National Seismic Hazard Mapping Workshop, Memphis, Tennessee, February 22-23, 2012. • Hall, T. M., and A. H. Sobel. “On the impact angle of Hurricane Sandy's New Jersey landfall” Geophysical Research Letters. May 28, 2013: 2312–2315. • Lin, N., K. A. Emauel, J. A. Smith, and E. Vanmarcke. “Risk Assessement of Hurricance Storm Surge for New York City.” Journal of Geophysical Research. September 25, 2010. • Nong, Shangyao, Jeffrey McCollum, Liming Xu, Michael Scheffler, and Hosam Ali. “Probabilistic Storm Surge Heights for the US Using Full Stochastic Events.” Paper presented at the AMS 29thConference on Hurricanes and Tropical Meteorology, Tucson, Arizona, May 10-14, 2010. • O’Sullivan, David, and David J. Unwin. Geographic Information Analysis. New York: Wiley, 2010. • Sweet, William, Chris Zervas, Stephen Gill and Joseph Park. “Hurricane Sandy Inundation Probabilities Today and Tomorrow.” Bulletin of the American Meteorological Society. September 2013: 517-20. • Tonini, Francesco. “Drought Risk Assessment – A Customized Toolbox.” Presentation at the ESRI International User Conference, San Diego, California, July 8-12, 2013. • Walton, Todd L. “Distributions for Storm Surge Extremes.” Ocean Engineering. December 2000: 1279-1293.