Download
1 / 38
380 likes | 498 Views
The Advanced Baseline Imager (ABI). Timothy J. Schmit NOAA/NESDIS/ORA Advanced Satellite Products Team (ASPT) in Madison, Wisconsin in collaboration with the Cooperative Institute for Meteorological Satellite Studies (CIMSS). GOES-R Users Conference 22 May 2001 . UW-Madison.

E N D
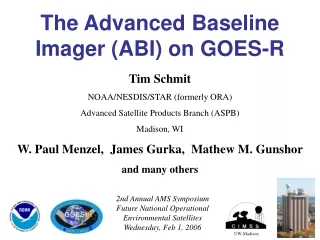
The Advanced Baseline Imager (ABI) Timothy J. Schmit NOAA/NESDIS/ORA Advanced Satellite Products Team (ASPT) in Madison, Wisconsin in collaboration with the Cooperative Institute for Meteorological Satellite Studies (CIMSS) GOES-R Users Conference 22 May 2001 UW-Madison
Imagers, circa 2010 30 years of 1 km IR data from AVHRR 10 years of high-resolution MODIS (AM and PM platforms) data - 36 channels with 1 km or finer spatial resolutions 10 years of China’s 10-channel polar-orbiting imager 7 years of MSG (METEOSAT Second Generation) data - 12 channels 7 years since the first GMS (-1R) with 2 km spatial resolutions
Limitations of Current GOES Imagers • Regional/Hemispheric scan conflicts • Low spatial resolution • Missing spectral bands • Eclipse and related outages
ABI - A Continuing Evolution To keep pace with the growing needs for GOES data and products, the Advanced Baseline Imager (ABI) follows an evolutionary path and addresses unmet NWS requirements. The need is documented. The technology is proven. The time is right to update the GOES imager!
Geostationary Imager Specifics ABI Current GOES Spatial resolution Visible (0.64 mm) 0.5 km Approx. 1 km All other bands 2 km Approx. 4 km Spatial coverage Full disk Every 15 mins Every 180 mins CONUS Every 5 mins Every 15/30 mins Operation during eclipse Yes No Spectral Coverage 8-12 bands 5 bands
MODIS 0.25 km Lake Effect Snow Bands: Visible MODIS 0.5 km MODIS 1 km 19 January 2001, 1720 UTC GOES-8 1 km
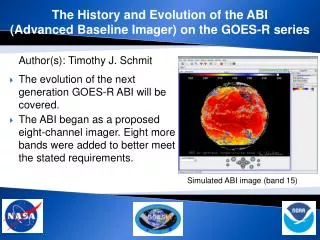
MODIS (1 km) ABI (2 km) Severe convection: IR windows 25 February 2001 GOES-8 (4 km) The simulated ABI clearly captures the over-shooting (cold) cloud tops, while the current GOES Imager does not. Images shown in GOES projection.
ABI spatial coverage rate versus the current GOES Imager ABI coverage in 5 minutes GOES coverage in 5 minutes The anticipated schedule for ABI will be full disk images every 15 minutes plus CONUS images every 5 minutes.
Outages due to Eclipse and the Keep-Out-Zone No data! GOES-8 (~3 hours of data outage) ABI (~0 hours of data outage)
Proposed ABI (8 or 12) channels Wavelengths DescriptionPrimary Use Range (m) Center 0.59 – 0.69 0.64 Visible Daytime cloud, smoke, fog 0.81 0.91 0.86* Solar window Daytime cloud, NDVI, fog, aerosol, ocean studies1.36 - 1.39 1.375* Near IR Daytime thin cirrus detection 1.58 – 1.64 1.61 Near IR Daytime clouds/snow, water/ice clouds 3.8 – 4.0 3.9 Shortwave IR Nighttime low clouds, fog, fire detection 5.7 – 6.6 6.15 Water Vapor 1 Upper tropospheric flow, winds 6.8 – 7.2 7.0 Water Vapor 2 Mid tropospheric flow, winds 8.3 – 8.7 8.5* IR Window 1 Sulfuric acid aerosols, cloud phase 10.1 – 10.6 10.35* IR Window 2 Cloud particle size, sfc properties 10.8 – 11.6 11.2 IR Window 3 Clouds, low-level water vapor, fog, winds, SST 11.8 – 12.8 12.3 IR Window 4 Low-level water vapor, volcanic ash, SST 13.0 – 13.6 13.3 Carbon Dioxide Cloud-top parameters, heights for winds * proposed additional channel to baseline of eight channels.
IR channels on current GOESand proposed 12-band ABI UW-Madison/CIMSS
Units: m and K Pressure Weighting Functions for the IR Channels (For the standard atmosphere at a 40 degree Local Zenith Angle)
Simulated GOES (from MODIS) Visible (at 1 km), WV (at 8 km), and three IR windows (at 4 km)
Simulated ABI (from MODIS)All images are displayed at 2 km resolution Two visible bands, two near IR and eight IR bands (10.3 not shown)
ABI High Spatial Resolution Visible (0.64 m)Based on GOES Imager Ch 1 Daytime clouds, smoke, fog
Utility of the 0.86mband • Provides synergy with the AVHRR/3. • Helps in determining vegetation amount, aerosols and for ocean/land studies. • Enables localized vegetation stress monitoring, fire danger monitoring, and albedo retrieval.
Burn Scars Scars (dark regions) caused by biomass burning in early September are evident in MODIS 250 m NIR channel 2 (0.85 μm) imagery on the 17th. MODIS Data from GSFC DAAC MODIS Detects Burn Scars in Louisiana 01 September 2000-- Pre-burning 17 September 2000-- Post-burning CIMSS, UW
1.88 m (or 1.38 m) is helpful for contrail detection Examples from MAS (Chs 2, 10, 16). Contrail detection is important when estimating many surface parameters. There is also interest in the climate change community.
Utility of the 1.6 m band • Daytime cloud detection. This band does not sense into the lower troposphere due to water vapor absorption and thus it provides excellent daytime sensitivity to very thin cirrus. • Daytime water/ice cloud delineation. (used for aircraft routing) • Daytime cloud/snow discrimination. • Based on AVHRR/3 and MODIS experience.
ABI Simulations Average 1-km MODIS data to 2-km spacing, apply blurring function (Point Spread Function) Point Spread Function (affects sharpness)GOES Imager (left) and ABI (right) for IR Window PSF data provided by MIT/LL
ABI (3.9 m)Based on GOES Imager Ch 2useful for fog, snow, cloud, and fire detection 5 March 2001 - Nocturnal Fog/Stratus Over the Northern Plains GOES-10 4 minus 11 μm Difference ABI 4 minus 11 μm Difference Both images are shown in the GOES projection. Fog UW/CIMSS ABI image (from MODIS) shows greater detail in structure of fog.
GOES-10 and ABI Simulations of Viejas Fire Smoke Plume(Using MODIS Data) MODIS (0.5 km) - GOES-ABI: visible 3 January 2001, 1900 UTC GOES-10 (1.0 km): visible 3 January 2001, 1900 UTC
GOES ABI and GOES-8/M Simulations of Viejas Fire Using MODIS Data: 3 January 2001 at 1900 UTC Simulated GOES ABI: 3.9 micron Simulated GOES 8/M: 3.9 micron Temperature (K) Temperature (K)
Mountain Waves in WV channel (6.7 um) 7 April 2000, 1815 UTC Simulated ABI Actual GOES-8 Mountain waves over Colorado and New Mexico were induced by strong northwesterly flow associated with a pair of upper-tropospheric jet streaks moving across the elevated terrain of the southern and central Rocky Mountains. The mountain waves appear more well-defined over Colorado; in fact, several aircraft reported moderate to severe turbulence over that region. Both images are shown in GOES projection. UW/CIMSS
ABI (6.15 and 7.0 m)Based on MSG/ SEVIRI and GOES Sounder Ch 11 Units: m and K Pressure Applications: upper level moisture, jetstreaks, and satellite-derived winds.
Utility of the 8.5 m band - volcanic cloud detection can be improved by detecting sulfuric acid aerosols (Realmuto et al.). Baran et al. have shown the utility of a channel near 8.2 m to detect sulfuric acid aerosols. - microphysical properties of clouds can be determined. This includes a more accurate and consistent delineation of ice clouds from water clouds during the day or night. - thin cirrus can be detected in conjunction with the 11 m. This will improve other products by reducing cloud contamination. - SST estimates can be improved by a better atmospheric correction in relatively dry atmospheres. - international commonality is furthered as MSG carries a similar channel (8.5 to 8.9 m) as well as MODIS and GLI. - surface properties can be observed in conjunction with the 10.35 m channel.
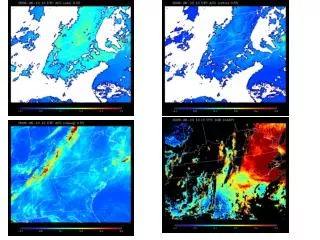
Vis/1.6um/11um Vis/4um/8.5-11um ABI Simulations: Water/Ice Clouds and Snow/Lake Ice 3-color composites 12 February 2001; 1627 UTC UW/CIMSS UW/CIMSS Vis/4um/11um Ice cloud Current Imager Lake Ice UW/CIMSS UW/CIMSS Vis/1.6um/8.5-11um Water cloud Ice cloud Super-Cooled cloud Lake Ice Snow
Water/Ice Clouds and Snow/Lake Ice ABI Simulations (from MODIS data) 3-color composite (Visible/1.6 μm/8.5-11 μm) 12 February 2001; 1627 UTC Vis/1.6um/8.5-11um Water cloud Ice cloud Super-Cooled cloud Lake Ice Snow UW/CIMSS UW/CIMSS
Utility of the 10.35 m band - microphysical properties of clouds can be determined. This includes a more accurate determination of cloud particle size during the day or night. - cloud particle size is related to cloud liquid water content. - particle size may be related to the “enhanced V” severe weather signature. - surface properties can be observed in conjunction with the 8.5, 11.2, and 12.3 m bands. - low level moisture determinations are enhanced with more split windows.
ABI (11.2 m)Based on GOES Sounder Ch 8 The many uses of the longwave infrared window: cloud images and properties, estimates of wind fields, surface properties, rainfall amounts, and hurricane and other storm location.
Hurricane Alberto IR -Window 19 August 2000, 1415 UTC ABI GOES-8
Satellite-derived winds Satellite-derived winds will be improved with the ABI due to: - higher spatial resolution (better edge detection) - more frequent images (offers different time intervals) - better cloud height detection (with multiple bands) - new bands may allow new wind products (1.38 m?) - better NEdT’s - better navigation/registration
ABI (12.3 m)Based on GOES Imager Ch 5 useful for low atmospheric moisture, volcanic ash, and SST David Foley, Joint Institute for Marine and Atmospheric Science, Univ of Hawaii SST will be improved with the ABI due to: - higher spatial resolution - more frequent images - better cloud and aerosol detection - better NEdT’s
Volcanic Ash Plume: 11-12 and 8.5-11 μm images UW/CIMSS One day after the eruption 20 February 2001, 0845 UTC Simulated Imager (11-12 μm) Simulated ABI (11-12 μm) Simulated ABI (8.5-11 μm)
Clear Low Cloud High Cloud ABI (13.3 m)Based on GOES Sounder Ch 5useful for cloud heights and heights for winds
Summary -- ABI • ABI addresses NWS Imager concerns by: • increasing spatial resolution • - closer to NWS goal of 0.5 km IR • scanning faster • - temporal sampling improved • - more regions scanned • adding bands • - new and/or improved products enabled • Simulations of the ABI show that the 12 channel version addresses NWS requirements for improved cloud, moisture, and surface products.
What if we could have more bands? • 9.6m -- total ozone • 14.2m -- better cloud heights • 4.57m -- better TPW • 0.47m -- aerosol particle size (over land) plus true color images (with other visible bands)
More information can be found at • http://cimss.ssec.wisc.edu/goes/abi/ • http://cimss.ssec.wisc.edu/modis1/modis1.html • MODIS • MAS • http://cimss.ssec.wisc.edu/nast/index.html • http://cimss.ssec.wisc.edu/goes/goes.html • Real-time Sounder page • GOES Gallery • Biomass Burning • http://www2.ncdc.noaa.gov/docs/klm/html/c3/sec3-0.htm • NOAA KLM User's Guide • http://www.eumetsat.de/en/ • MSG..System..MSG..Payload..Spectral bands..Spectral bands