Download
1 / 22
220 likes | 308 Views
Transit Agency Status FY 2011-12. Current Financial Position Current Operations Service Statistics/Trends Funding Statistics/Trends Other Information/Assumptions Capital Status Review Statewide Cost Saving Ideas. Current Financial Position. Reserves/Retained Earnings

E N D
Transit Agency Status FY 2011-12 • Current Financial Position • Current Operations • Service Statistics/Trends • Funding Statistics/Trends • Other Information/Assumptions • Capital Status Review • Statewide Cost Saving Ideas
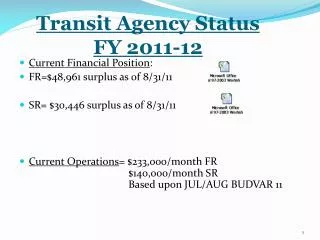
Current Financial Position • Reserves/Retained Earnings N/A Clarion County Transit does not retain any reserves or balances. Operations are outsourced.
Current Financial Position • Level of Short-Term Debt/Loans—Identify each line of credit (excludes long-term bond financing)
Current Financial Position • Accounts Payable – Past due 90 days and over • Accounts Receivable – Past due 90 days and over
Current Operations • Staffing Level • Contract Provisions • Healthcare • Pension • Fuel • Fares • Other major factors producing cost increases above inflation • Cost Savings Initiatives
Labor Provisions • Term of current union contract ________ to __________ Non-union contract
Important Labor Provisions • Use of part-time employees – 7 PT drivers • Number/percent of “split shift” drivers – not needed • Overtime – less than 1% • Outsourcing – outsource some MATP trips to taxis
Healthcare • We anticipate savings from planned biometric screenings for wellness. • We also have available an alternative lower cost plan for employees.
Pension Employees are eligible for a 401k plan with a 25% match on contributions up to 5% of their salary.
Pension • Describe any proposed changes and the estimated financial impacts. • None • Provide a status of the degree to which the pension funding is funded. If not fully funded please provide your strategy to fully fund pension. • The 401k plan is a defined contribution plan, and is fully funded.
Fuel • Current Cost per Gallon • Contract rate or market rate? $3.30 per gallon is the most recent 30 day average • Terms of contract (if applicable) – n/a. All fuel is purchased at current market rates. • Projected Cost per Gallon and Basis for Projection • Contract rate or market rate? $3.40 based on 3% inflation factor • Terms of contract (if applicable) – n/a
Shared Ride Fares • Date of Last Fare Increase 4-1-11 • Current • Average fare - $34.33 per trip • Planned Changes • Date of planned decrease– 4-1-12 • Estimated average fare – $33.64
Other Major Factors Producing Cost Increases Beyond Inflation
Statewide Cost Saving Ideas • Regional Brokerage Model to promote • Increased productivity through: • Inter-county coordination of trips between counties • Fixed schedules for long distance trips across multiple counties. • Increased competition between transportation providers reduces rates and improves quality of service • Brokerage Model Types • Expand the Mandatory HealthChoices Program, or • Regional Direct Brokerage Model
Statewide Cost Saving Ideas • In-person ADA assessments (Physical and Cognitive) • Identifies more persons capable of using fixed routes • Typical Results • 25% no show to appointments • 5% determined capable of riding fixed routes • 20% placed in conditional status • Effective controls growth of demand response programs • Travel training • Individuals become more confident and self-reliant as a result of learning to travel independently. • Travel training is always provided in the participant’s community, using real buses and situations. • Training can be delivered one-on-one or in group settings.
Statewide Cost Saving Ideas • Promote healthy competition within the passenger transportation provider business by reducing duplicative and unnecessary oversight • Currently overseen by PennDot and the Public Utilities Commission • Keep oversight focused on Safety, but not controlling competition