Download
1 / 54
560 likes | 760 Views
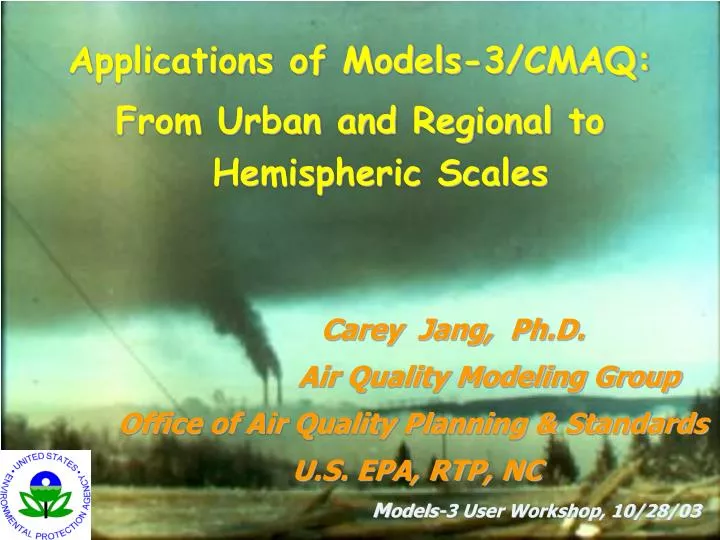
Applications of Models-3/CMAQ: From Urban and Regional to Hemispheric Scales. Carey Jang, Ph.D. Air Quality Modeling Group Office of Air Quality Planning & Standards U.S. EPA, RTP, NC M odels-3 User Workshop, 10/28/03. Los Angeles Forest Fire Oct. 26, 2003. OUTLINE.

E N D
Applications of Models-3/CMAQ: From Urban and Regional to Hemispheric Scales Carey Jang, Ph.D. Air Quality Modeling Group Office of Air Quality Planning & Standards U.S. EPA, RTP, NC Models-3 User Workshop, 10/28/03
Los Angeles Forest Fire Oct. 26, 2003
OUTLINE • “One-Atmosphere” : Linkages of Ozone and PM (and other pollutants) • “One Modeling System”: Urban, Regional, and Hemispheric Scales • “One Community”: U.S., Pacific/Atlantic Regions, East Asia (China & Taiwan)
One-Atmosphere Approach Mobile Sources Ozone NOx, VOC, PM, Toxics PM (Cars, trucks, planes, boats, etc.) Industrial Sources Acid Rain Chemistry Meteorology Visibility NOx, VOC, SOx, PM, Toxics (Power plants, refineries/ chemical plants, etc.) Air Toxics Atmospheric Deposition Area Sources Climate Change NOx, VOC, PM, Toxics (Residential, farming commercial, biogenic, etc.)
Example of “One-Atmosphere” Modeling Impact of 50 % NOx Emission Reduction on PM 2.5 July 15, 1995
Impact of 50% NOx emission reduction Nitrate PM decrease Sulfate PM decrease July 15, 1995
Impact of 50% NOx emission reduction O3 decrease HOx decrease July 15, 1995
Formation of Secondary PM (PM2.5): Sulfate PM formation: H2SO4 + 2 NH3 ---> (NH4)2SO4 (s) Gas Phase: SO2 + OH ---> H2SO4 Aqueous Phase: S(IV) + H2O2---> H2SO4 (Dominate over low pH) S(IV) + O3 ---> H2SO4 Organic PM formation: VOC* + OH, O3, NO3 Gas Phase: ---> Condensable VOC products (semi-volatile) Aerosol Phase:---> SOA *: Long-chain VOC (C7 & above), Aromatics, Biogenic VOC (terpene) Nitrate PM formation: HNO3 + NH3 <---> NH4NO3 (aq,s) Gas Phase:(daytime) NO2 + OH ---> HNO3 Gas & Heterogeneous Phase : (night) N2O5 + H2O ---> HNO3
Impact of 50% NOx emission reduction O3 decrease HOx decrease July 15, 1995
Impact of 50% NOx emission reduction Nitrate PM decrease Sulfate PM decrease July 15, 1995
50% NOx reduction Nitrate PM Sulfate PM --(decrease) -- (decrease) (July monthly Average, 1996)
50% NOx reduction Ozone Organic PM --(decrease) -- (decrease) (July Average, 1996)
Secondary PM formation Linkages between O3 and PM
.OH Role in Linking Pollutants Formation : One-Atmosphere PM2.5 SOx [or NOx] + NH3 + OH ---> (NH4)2SO4 [or NH4NO3] VOC + OH ---> Orgainic PM One Atmosphere Ozone Visibility One Atmosphere Fine PM (Nitrate, Sulfate, Organic PM) .OH NOx + VOC + OH + hv ---> O3 Acid Rain Water Quality SO2 + OH ---> H2SO4 NOx + SOx + OH (Lake Acidification, Eutrophication) NO2 + OH ---> HNO3 OH <---> Air Toxics (POPs, Hg, etc.) Air Toxics
OUTLINE • “One-Atmosphere” : Linkages of Ozone and PM (and other pollutants) • “One Modeling System”: Urban, Regional, and Hemispheric Scales • “One Community”: U.S., Pacific/Atlantic Regions, East Asia (China & Taiwan)
Air Quality Modeling Applications at EPA/OAQPS Trans-Pacific Modeling Domain ChinaModeling Domain U.S.Modeling Domain 36 km eastern US domain 4 km domain 12 km domain 12 km western US domain 36 km western US domain 36 km Annual National US domain
M3/CMAQ Applications at EPA/OAQPS • “U.S.” Modeling: Air Quality Modeling Group(Jang, Dolwick, Timin, Possiel, Tikvart, Evangelista, Braverman, Strum, etc.) • “Intercontinental” Modeling: EPA (Jang, Doll), UNC-CEP (Hanna, Vukovich, Xiu, Adelman, Mathur) ANL (Streets), Harvard (Jacob), Stanford (Jacobson),U. of TN (Fu), U. of Iowa (Woo), NCSU (Xie & Wang) • “East Asia” Modeling: EPA(Jang), U. of TN (Fu), ANL (Streets), U. of Iowa (Woo), NCSU (Xie & Wang), China-SAES, Taiwan-CCTI & NCKU EPA/ORD Support is the key for the success !
Models-3/CMAQ Simulation: Annual Average (1996) PM 2.5 Sulfate PM Organic PM Nitrate PM
Nitrate PM CMAQ-2001 CMAQ-2002 CMAQ-Sept03 (January avg., 1996)
Anthropogenic SOA Biogenic SOA 15 ug/m3 0.6 ug/m3 CMAQ- 2002 7 ug/m3 0.2 ug/m3 CMAQ- 2003 (July avg., 1996)
Ozone CMAQ-2002 CMAQ-2003 (July avg., 1996)
Sulfate PM CMAQ-2002 CMAQ-2003 (July avg., 1996)
Air Quality Modeling Applications at EPA/OAQPS Trans-Pacific Modeling Domain ChinaModeling Domain U.S.Modeling Domain 36 km eastern US domain 4 km domain 12 km western US domain 12 km domain 36 km western US domain 36 km Annual National US domain
Air Pollution Truly Has No National Boundaries
Asian Dust Storm Event: April 2001 (NASA/TOMS) (4/7) (4/9) (4/11) (4/12) (4/13) (4/14)
ASIAN DUST REACHED WESTERN U.S. (April 1998) SF LA GOES Satellite Image PM10 West Coast (Courtesy of Prof. Husar, WUSL)
Transport of CO : March 2000 (NASA/MOPITT) (3/10) (3/12) (3/15) (3/13) (Byun and Uno, 2000)
Intercontinental Transport & Climatic Effects of Air Pollutants (ICAP): USEPA’s International Modeling Project Models-3/CMAQ “Trans-Pacific” modeling Domain
ICAP Emissions Data Preparation & Processing NOx Emissions (VOC) VOC (PAR) Emissions
U.S. emissions Canada emissions Mexico emissions
Population LPSs & Volcano Landcover Ship lanes Road network Asian emissions data (TRACE-P & ACE/Asia) Energy/ Emission Regional Emis. GIS Remote Sensing /etc. FC AI Precipitation Courtesy of Dr. Jung-Hun Woo, Univ. of Iowa
Large Point Sources Industry Transportation Smaller Power Biomass Burning Domestic Fossil Fuel Shipping Aviation FC AI
ICAP Trans-Pacific Modeling Domain Trans-Pacific Transport of Air Pollutants: PM
ICAP Trans-Pacific Modeling Domain Trans-Pacific Transport of Air Pollutants: PM
ICAP Trans-Atlantic Modeling Domain Trans-Atlatic Models-3/CMAQ Modeling Domain
ICAP Plan FY’04-’05 Proposed activities: • Integrate satellite (MODIS, TOM, GOME, etc.) observations and surface-based & aircraft (ITCT, TRACE-P) data with model simulation results • Continue intercontinental & regional modeling assessment for selected current & future policy-relevant emissions scenarios • Develop & apply an integrated model with coupled meteorology and chemistry (e.g., MM5 & CMAQ) to study the impact of air pollution on regional climate • Continue to support development of improved emission inventories and future emission scenarios • Conduct a pilot study on integrated environmental health & climate assessment of air pollution over key emissions-growing regions such as Asia
Air Quality Modeling Assessment Projects over Greater China Regions Beijing and Shanghai modeling studies being initiated 4-km Taiwan modeling study is on-going 12-km China National/regional modeling study to be completed in Oct. `2003 36-km
Air Quality Modeling over China : Ozone 12-km 36-km
Projected Air Quality over China (July 4-20, 2001, episodic average) 2008 (Business as usual) PM 2.5 (No change from 2001) 2008 (Growth Scenario) 2008 (Control Scenario) (Man-made emissions + 50%) (Man-made emissions -- 50%)
Air Quality Modeling over China : PM PM 2.5 Sulfate PM Nitrate PM Organic PM
Air Quality Modeling over China & Taiwan :Model Nesting 12-km 4-km 36-km
Nested Modeling at Different Grid Resolution: PM 2.5 4-km (non-nested) 12-km 36-km Taiwan (Jan. 4-20, 2001, episode avg.)
36/12/4km CMAQ: Sulfate PM (Episodic Average) 12-km 4-km 36-km Atlanta, Georgia (July 4-16, 1995)
36/12/4km CMAQ: Cloud Fraction 4-km 12-km Atlanta, Georgia (July 14, 1995), predicted by MM5
Air Pollution Control in 21st Century State/ Multi-Counties Federal/ Multi-State City /Town International County 1920 1950 1970 1980 1990 2000
PM2.5 in Beijing (Model simulation) M3/CMAQ (12-km) Jan. 4-20, 2001 Mass: 121.4 ug/m3 PM2.5 in Beijing (Monitoring data) Annual Average for all sites (2000): Mass: 95.5 ug/m3 (Courtesy of Prof. Zhang, Beijing Univ., 2002)
Projected Air Quality over China (July 4-20, 2001, episodic max) 2008 (Business as usual) Ozone (No change from 2001) 2008 (Growth Scenario) 2008 (Control Scenario) (Man-made emissions +50%) (Man-made emissions -- 50%)
Air Quality Modeling over China : PM 2.5 12-km 36-km