Download

1 / 48
480 likes | 493 Views
GREENSTONE PETITION. 18 April 2018. CONTENT. Size and shape of the GDE In-Migration Ordinary Schools Infrastructure Planning Petition Response Concluding Remarks. Size and Shape of the GDE. Number of Institutions (2017). Institutions (2017). Number of Educators (2017).

E N D
GREENSTONE PETITION 18 April 2018
CONTENT • Size and shape of the GDE • In-Migration • Ordinary Schools • Infrastructure Planning • Petition Response • Concluding Remarks
Learners Entering Ordinary Schools from Outside of Gauteng by Province
Number of Learners in Ordinary Schools by Grade and Gender 19
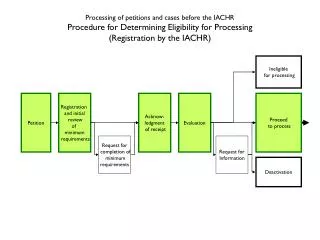
Education Infrastructure Planning Process A typical Education Infrastructure Planning Process comprises the following five chronological steps: Data collection Needs analysis Project identification Prioritisation of identified needs Budgeting
1. Data Collection – New Schools (a) New Schools: • The number of schools required is directly linked to the number of learners of school going age in the province. • As schools are required in the area where a child lives the number of learners per residential area must be known. • The finalisation of Feeder Zones will simplify this process.
1. Data Collection – New Schools (cont.) Determining the number of learners in a new / developing residential area? • 1 primary school per 1 000 residential units • 1 secondary school per 2 000 residential units
1. Data Collection – New Schools (cont.) Determining the number of learners in an existing developed residential area? • Learner enrolment in existing schools • Learner distribution per residential area in existing schools • Number of residential units (as in the case of a new developing residential area) • StatsSA data
1. Data Collection – New Schools (cont.) How is the collected data captured? • Residential Units per residential area spreadsheet PRP 01 Residential Units per Area Spreadsheet.xls • Number of learners per residential area (Planning Zone) spreadsheet PRP 02+03 Enrolment per Residential Area.xls • Learner distribution per residential area spreadsheet Example Learner Distribution per Residential Area.xls
1. Data Collection – Additions to Existing Schools (b) Additions to existing schools: • In order to determine what additional facilities are required at existing schools one must know what facilities exist at each school. • The data to be collected will therefore include the following:PRP 04 Schools Data Spreadsheet.xls
1. Data Collection - Rehabilitation • Rehabilitation of schools • The Directorate has initiated a process to establish a Facilities Management System(FMS) as far back as 2005. • However, when DoE introduced NEIMS it was felt that it would be a duplication, hence the process was halted. • NEIMS has however not been developed into a FMS. • In the interim an over simplified inefficient method of data collection is used. • NEIMS provides the following information: Schools Condition Rating 14Apr09.xls • This information is augmented by the following:Revised Maintenance Priority (Queuing) List 2012.xlsx Schools Requests.xls
2. Needs Analysis • New schools: An over-simplified method for analyzing the need for a new school:
DISTRICT A Residential Area 2: Residential Area 1: Future Residential Area 3:
Residential Area 2:2 500 prim school learners1 250 secondary school learnersExisting no. of schools:1 Prim Residential Area 1:4 000 primary school learners2 000 secondary school learnersExisting no. of schools:4 Prim + 2 Sec Prim 1 Prim 1 Prim 1 Prim 1 Prim 1 Prim 1 Prim 1 Sec 1 Sec 1 Sec 1 Sec 1 Sec 1 Sec 1 Prim 2 Prim 2 Prim 2 Prim 2 Prim 2 Prim 4 Prim 4 Prim 4 Prim 4 Prim 3 Prim 3 Prim 3 Prim 3 Sec 2 Sec 2 Sec 2 Sec 2 This is the actual number of learners living in the res. area DISTRICT A Future Residential Area 3: 4 700 residential units = 100 residential units
Residential Area 1: 4 000 primary school learners 2 000 secondary school learners Prim 1 Prim 1 Prim 1 Prim 1 Prim 1 Prim 1 Sec 1 Sec 1 Sec 1 Sec 1 Sec 1 Sec 1 Prim 2 Prim 2 Prim 2 Prim 2 Prim 2 Prim 4 Prim 4 Prim 4 Prim 4 Prim 3 Prim 3 Prim 3 Prim 3 Sec 2 Sec 2 Sec 2 Sec 2 DISTRICT A – RESIDENTIAL AREA 1
Prim 1 Residential Area 2: 2 500 primary school learners 1 250 secondary school learners DISTRICT A – RESIDENTIAL AREA 2
Future Residential Area 3: 4 700 residential units DISTRICT A – RESIDENTIAL AREA 3 = 100 residential units
Vacant GDE SitesVACANT GDE SITES • It is an increasing trite but accurate truism that the world is getting smaller. A land piece of fixed size is occupied by an increasing number of people. • As the epicentre of urbanisation in Africa, Gauteng experiences the highest densities of all provinces in South Africa. • Density, demand and supply for land, competition for land, urbanisation rate, socio-economic status of people, etc make land in Gauteng one of the most scarce and expensive commodity in South Africa. • The department has no option but to acquire the sites in order to roll out schools with the aim of matching demands of increasing number of learners. • The composite list here puts the number at 653 which in reality can be more or less considering that some may have been illegally occupied, consolidated with other school sites or donated to other user departments in terms of GIAMA.
PETITION • Has her department undertaken studies to determine the total number of children who live in the Greenstone residential area in Johannesburg, which borders Edenvale in the Ekurhuleni Metropolitan Municipality; if not, (a) why not and (b) what informed the decision of her department not to build any schools in the specified area; if so, what are the details of the study?
RESPONSE – Study • Yes a study has been conducted: the study showed that schools around the area are populated by children from Tembisa and Alexandra. • Hereunder are schools that cater children from Tembisa and Alexandra: • Nobel Primary School – This school is about 2km radius away from the area in question and is populated by learners from Tembisa and Alexandra. These learners are transported privately by parents to schools. • EastleighPrimary School - This school is also about 3km radius away from the area in question and is populated by learners from Tembisa and Alexandra. These learners are transported privately by parents to schools. • Edenglen Primary School - This school is also about 3km radius away from the area in question and is populated by learners from Tembisa and Alexandra. These learners are transported privately by parents to schools.
RESPONSE – Study cont. • Only one school in the vicinity of Greenstone is above 100% in terms of its capacity. • The remainder of schools are not fully occupied hence no need for a school to be built in the area. • Challenge: the Edenvale area does not have available sites for the construction of school infrastructure. • Aerial map to follow in next slide illustrates the location of the above tabled primary schools and further illustrates how dense the area is.
RESPONSE – Existing Primary Schools Location of the Primary Schools tabled in the previous slide are illustrated in the Aerial map below: • A minimum of three (3) schools located within the Greenstone and Greater Edenvale areas. • Areas in question is fairly dense however the existing schools are believed to compliment existing population numbers. • Areas in question are highly built up with no adequate sized vacant properties available. • The residential areas in question are located within substantially serviced by commercial and industrial land uses (bordering along the northern and eastern areas), which has limited residential development and thus less population numbers.
RESPONSE – Learner Numbers The above table analysed in conjunction with the table illustrated on Slide No. 4, tells us the following: • The predominant number of learners come from the areas of Alexandra and Tembisa: • Eastleigh Primary School: 978 – 388 = 590 learners • Edenglen Primary School: 1353 – 651 = 702 learners • Laerskool Nobel: 1109 – 48 = 1061 learners • Even with the additional learners that come from surrounding areas of Alexandra and Tembisa, these existing Primary Schools are still not fully occupied to capacity. • This further indicates that learners whom reside within the Greenstone and Edenvale areas, are attending at schools not located within their area.
RESPONSE – Distance Following the previous slide, the aerial map below illustrates the distance from Edenvale to the Alexandra and Tembisa areas: • The distance travelled by learners from the Alexandra area to the Edenvale area measures approximately 7km. • The distance travelled by learners from the Tembisa area to the Edenvale area measures approximately 16km. • Challenge: the Alexandra and Tembisa areas are in themselves highly dense and built up areas (far exceeding densities of Greenstone and Edenvale) with no sizeable vacant properties available.
RESPONSE – Available Sites The aerial map below illustrates the nearest available sites large enough to accommodate a school to the areas of Greenstone and Greater Edenvale: • The two (2) closest located sites which are large enough to accommodate a school are located within the area of Terenure and Edleen. Located approximately 7km away from the Edenvale area. • These school sites are located approximately 7km away from the Tembisa area, meaning the construction of a school on these sites could service this area.
RESPONSE – Concluding Remarks • The study shows that the Greenstone and Greater Edenvale areas do not warrant for new school infrastructure, as the existing schools are not fully occupied to capacity. • It is clear that the parents within these areas prefer having their children attending at schools outside of the area. • Considering the existing residential densities within the areas in question, the existing schools are adequate to service these areas. • The unavailability of sites in general, let alone adequately sized sites, contributes to the inability to construct new schools.
Context for Infrastructure Delivery • Massive growth in annual demand for learning spaces – 100 000 new learners annually • Need to comply with National Norms and Standards (Regulations) • Imperative to respond to sector and provincial targets (APP and Deliverology framework) • Need to satisfy accounting bodies – HR Commission, Legislature, etc. • Infrastructure programme respond to needs in: Public ordinary schooling, including ICT schools, Special schools and Early Childhood • Funding – Equitable share and Infrastructure grant, as follows: Challenges in infrastructure delivery: • Delivery capacity: infrastructure unit and delivery agents • Access to land – municipalities • Funding – Available funding is not enough to cater for all demands of a growing province