Download
1 / 11
110 likes | 119 Views
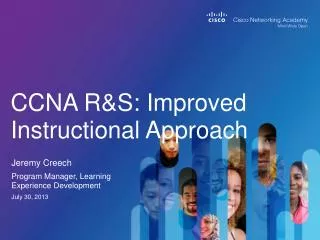
VSM: Approach & Key Learning’s. Initial Approach. Confusion over mission and scope VSM knowledge in the wider business There was an initial perception that the CI and VSM process were in conflict. Project structure – E.g. jumping to solution mode

E N D
Initial Approach • Confusion over mission and scope • VSM knowledge in the wider business • There was an initial perception that the CI and VSM process were in conflict. • Project structure – E.g. jumping to solution mode • Time taken: Should return improvement within 3-6 months • Communication and Stakeholder awareness
What was changed • Introduced LSS thinking and methodology to structure an approach going forward • Clarified and expanded mission and scope after revisiting original objectives • Agreed and aligned approach between CI and VSM activity • Actively engaged with the factory to ensure buy-in and support
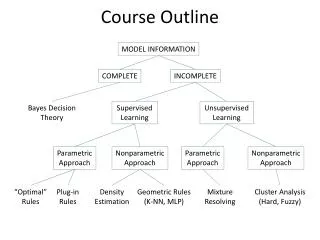
Revised Approach We used the following DMAIC process to structure the project Select event sponsor Select team members Gather necessary data / information Create a Project Charter Create a SIPOC Diagram DEFINE Take “before” photos of the area Map / walk the process (VSM) Understand the current baseline / conditions Create a set of performance measures MEASURE Analyse the VSM and data Brainstorm possible solutions and prioritise Create future state process map (VSM) Determine the best course of implementation steps Create action item list ANALYSE Implement a pilot Review pilot data and correct if necessary Implement the final solution Take photos of the improved area IMPROVE Review performance metrics Create SOP's Complete action item list Create Kaizen team presentation Present results CONTROL
Some examples from VSM Transit Packaging storyboard using revised approach
Project Charter DEFINE
Process Flow - Transit Packaging DEFINE Production at Haddenham Product packed ready for despatch End customer receives products Product shunted to Jervis & stored in bulk location Product stored at Conway Product picked (full pallets and case picking)
SIPOC Diagram MEASURE
Identifying Wastes ANALYSE • Waste comes in many forms, described using the “Seven Wastes”: • Transportation (moving material/product from one place to another) • Inventory (material/product/information waiting to be processed) • Motion (excess movement and/or poor ergonomics) • Waiting (delays caused by shortages, approvals, downtime) • Overproduction (producing more than is needed) • Overprocessing (adding more value than the customer is paying for) • Defect/Rework (doing the same job/task more than once) Benefits & Expectations of Reducing Waste • Less Labour Requirements • Less Space Requirements • Increased Flexibility • Decreased Costs • Improved Quality • Improved Responsiveness • Increased Innovation • Increased Employee Enthusiasm
Trial Solutions IMPROVE × × Silvo Tote Smurfit 1 Smurfit 2 × × Saica 1 Saica 2 × × Corex 1 Corex 2
Quad Summary Objectives / Work Completed • Completed Charter • Walked the process (both Hadd & Jervis) • Completed team launch (SIPOC/VOC) • Validated financial benefits with Sponsor (Money belt) • Collated base line data for analysis • Completed Kaizen event (VSM) • Identified and prioritised solutions • Trial solutions • Measures • Line speed • Performance to plan • Cases per pallet • Defects • Process lead time Issues / Concerns & Counter Measures • Next Steps • Trial Smurfit tote (in process) • Pilot the improvements • Gather / collate measure data • Implement the improvements / final solution • Review performance metrics • Create SOP’s • Identify key measures for on-going monitoring (dashboards) • Present results