Download
1 / 16
160 likes | 223 Views
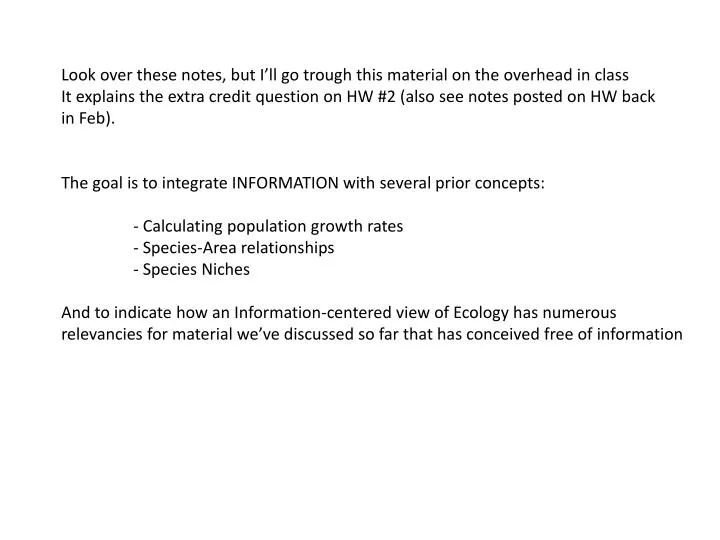
Look over these notes, but I’ll go trough this material on the overhead in class It explains the extra credit question on HW #2 (also see notes posted on HW back in Feb). The goal is to integrate INFORMATION with several prior concepts: - Calculating population growth rates

E N D
Look over these notes, but I’ll go trough this material on the overhead in class It explains the extra credit question on HW #2 (also see notes posted on HW back in Feb). The goal is to integrate INFORMATION with several prior concepts: - Calculating population growth rates - Species-Area relationships - Species Niches And to indicate how an Information-centered view of Ecology has numerous relevancies for material we’ve discussed so far that has conceived free of information
Consider temporal variation in growth rates Such as our rhino example in class GOOD = 2.0 PGOOD = 0.5 PBAD = 0.5 BAD = 0.1 For 1 population: (2)0.5 × (0.1)0.5 = 0.447 For 2 populations: Pop 1 Pop 2 Mean Permutations 2 .1 1.05 1 1 2 Alternatives: 2 2 Alternatives: .1 .1 Alternatives: 2 .1 4 (2)? × (0.1)? × (1.05)? = ??? (2)0.25 × (0.1)0.25 × (1.05)0.5 =
For 3 populations: Pop 1 Pop 2 Pop 3 Mean Permutations (how to quickly find these) 2 1.367 0.733 0.1 1 3 3 1 Alternatives: 2 2 2 Alternatives: 2 2 .1 Alternatives: 2 .1 .1 Alternatives: .1 .1 .1 (2)1/8 × (1.367)3/8 × (0.733)3/8 × (0.1)1/8 = 0.818
Short-cut: Binomial expansion and Pascal’s Triangle (x+y)E 1 1 1 1 2 1 1 3 3 1 1 4 6 4 1 1 5 10 10 5 1 E =0 E=1 E=2 E=3 E=4 E=5 Pop 1 Pop 2 Pop 3 Mean Permutations 2 1.367 0.733 0.1 1 3 3 1 Alternatives: 2 2 2 Alternatives: 2 2 .1 Alternatives: 2 .1 .1 Alternatives: .1 .1 .1 (2)1/8 × (1.367)3/8 × (0.733)3/8 × (0.1)1/8 = 0.818
Source 1.0 Sink PMIN # Populations (P)
# Populations PMIN AMIN Area (A)
2 × 2 × 2 × 0.1 × 0.1 × 0.1 = ? Growth rate? 2 × 0.1 × 2 × 0.1 × 2 × 0.1 = ? What’s the difference between the two scenarios?
QUESTIONS Consider two 6-yr sequences: Growth rate? 2 × 2 × 2 × 0.1 × 0.1 × 0.1 = ? What’s the difference between the two scenarios? Can you extract information About the future from either sequence? Would it change your dispersal behavior? 2 × 0.1 × 2 × 0.1 × 2 × 0.1 = ? A Worked Example (3 populations) 2 2 0.1 0.1 0.1 0.1 0.1 0.1 2 2 0.1 0.1 2 2 2 0.1 (2)5/6 × (0.1)1/6 = 1.10 0.918 (2)4/6 × (0.1)2/6 = 0.738
PMIN # Populations AMIN Area
GEOM • uniform dispersal • good and bad yrs, • but no spatial or temporal • correlation Information-free World GEOM ARITH - [2 – (n+1)cov]/(2n) • Population growth rate • increases with number • of patches (n)
Information-free World 250 200 150 Mean persistence time 100 uniform dispersal, rho = 0 50 uniform dispersal, rho = 0.7 0 2 3 4 5 6 7 8 Number of patches
disperse = 1-(probreproductive success) Win-stay:lose-switch A rule-of-thumb to bias settlement within Productive habitats site fidelity = probreproductive success
2000 1500 1000 WSLS, rho = 0 500 WSLS, rho = 0.7 0 2 3 4 5 6 7 8 Number of patches 250 200 150 Mean persistence time 100 Added Information plus adaptive behavior uniform dispersal, rho = 0 50 uniform dispersal, rho = 0.7 0 2 3 4 5 6 7 8 Number of patches
Conclusions • The addition of adaptive decision-making into population models • dramatically alters their conclusions • Temporal correlation (runs of good and bad years) can increase • persistence because prior experience is informative • It requires both temporal correlation AND the WSLS-rule • to enhance population persistence – the appropriate behavior • must be coupled with the appropriate environment • Clear conservation message • Organisms with information can survive in smaller areas (fewer patches) • For given area/patches, increases with information
Fundamental Niche The Niche concept place in a Population Framework R0 < 1.0 Realized Niche R0 > 1.0 Factor Two Factor One
Sunlight – resource (‘biotic’ factor) Warm – abiotic factor Photoperiod – INFORMATION 40% less photosynthesis 40% less gas exchange Knock-out Can’t determine photoperiod Wild Type