Download
1 / 15
150 likes | 302 Views
A new challenge for official statistics: integrating objective and subjective indicators. Linda Laura Sabbadini Director Surveys on living condition and quality of life National Statistical Institute of Italy . Policies need subjective and objective indicators.

E N D
A new challenge for official statistics: integrating objective and subjective indicators. Linda Laura Sabbadini Director Surveys on living condition and quality of life National Statistical Institute of Italy
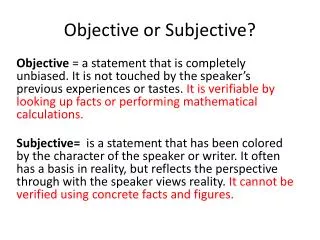
Policies need subjective and objective indicators • Objective indicators often provide only a part of the required information of policies. Success in some goals of policies can be measured objectively, but such measures have their limitations and in some cases additional subjective indicators are required. • I would like to show some examples from our experience on the importance of subjective indicators for social policies. • The challenge of official statistics is to combine the strength of these indicators and to make sense of the discrepancies they show. • We can consider different situations: • - the chosen subjective indicator is a really proxy of the phenomenon; • the subjective indicator seems to show contradictory results compared to the objective indicator but it describes different dimensions and helps to better understand the phenomenon.
The chosen subjective indicator is a really proxy of the phenomenon: perceived health A wide consensus is emerging about the crucial role played by perceived health as a predictor of mortality, particularly in older age groups. Many studies, epidemiological or population surveys, carried out in different countries converge on the result that self-rated health is a significant independent predictor of survival, even after controlling for socio-demographic covariates and physical health status (Krause and Jay, 1994; McCallum et al., 1994; for a in-depth discussion of the main results, see Idler, 1992), and even when answers are given by family informed respondents (proxy evaluations) (Lawrence and Assmann, 1997). Persons who rate their health as ‘poor’ have a higher risk of dying compared with people who feel ‘good’ or ‘very good.’
The subjective indicator seems to show contradictory results compared to the objective indicator: fear of crime Istat data from victimization survey clearly show that people’s insecurity due to crime has become a remarkable social problem which can no longer be denied or neglected. We use two important indicators: the sense of safety to walk alone along the streets in one’s own district at night and the sense of safety to be alone at home at night Many researchers refused to consider the fear of crime as a social concern that policy makers should take into account. THEY THINK IT IS NOT RATIONAL and it is due to wrong information about the actual risks, diffused by media . Istat findings show thatcrime fear depends on the number of predatory crimes, is related to victimization (bag-snatching, robbery or burglary.) The bag-snatching is the most affecting victimization experience. People who suffered bag-snatching in the last three years are very often not safe when walking alone down the streets of their district at night. This type of insecurity is even related to robberies, assaults and burglaries. Other types of victimization are weakly related. Insecurity at home is deeply affected by burglaries. However, even assaults are strictly related to this type of insecurity. In this case bag-snatching and pocket-picking are weakly related .
Social and physical “disorder” of the community plays an important role. “Disorder” causes fear both directly and indirectly, fostering the increase of predatory crime.Social disorder is when in an area there are drug pushers and drug addicts, prostitutes, beggars, homeless sleeping in public places, drunkards…. Even in our country social “disorder” is strictly related to crime fear. The higher is the number of incivility types examined in a place where a person lives the more likely he feels unsafe . It affects much more unsafety on to the outer (streets and squares) than the home environment Crime fear depends on the number of predatory crimes committed every year, on how individuals perceive the chance these may occur and on their seriousness. It arises, spreads and strengthens because of the repetition,in one’ own neighbourhood, of apparently irrelevant actions or events but which, as a whole, are perceived as signs of a community whose moral order has collapsed In conclusion fear is not irrational[
The apparent paradox: fear of crime is higher in groups with a lower percentage of victimization In Italy and in others countries changes in sex and age concerning personal fear don’t seem to reflect actual risks of victimization. Elderly people are those who feel not safe in the streets and at home, but they have the lowestpercentage of victimization. In Italy fear is more widespread among lower class people, while middle upper class ones are those who more often experience predatory crimes. In Italy there are remarkable differences between women and men as to the fear of crime. Women more often experience bag snatching, and pocket picking, men experience more often assaults and robberies. That is not a paradox. If women are more often afraid than men, it is above all because they run a risk that men do not know: harassment and rape. If fear is more widespread among elderly people, women, and underprivileged people it is because they are more vulnerable. If the fear of crime is high, the reasons have to be understood, policies to diminish the people’s fear have to be designed. These indicators are very useful for policies. For this reason Istat decided to carry out a survey on safety with questions on victimization, and on fear of crime
The importance of a subjective indicator for policies on violence against women Italian Statistical Institute carried out a survey on violence against women. From the policy point of view it’s important not only to know if the women have been abused by the partner, but also if they’re able to recognize the violence as a crime. It ’s very difficult to assess the goal of preventing and contrasting violence against women if we don’t measure this kind of indicator. Many women don’t report the violence to the police because they don’t recognise the partner’s violence. Monitoring this subjective indicator is very important to design sensitization campaigns and to verify the results and the impact. For this reason I think that it’s important to consider the perception on “what violence is” among the recommended UN indicators we are studying.
People who feels to be poor: can we neglect them? In 2002, 11 households out of 100 live in relative poverty; however, households that felt poor or very poor constitute 8,7%. In the North, perception of poverty is more spread than the real incidence of poverty, in the South the percentage of households that feel poor is lower than the real incidence of poverty. The higher perception of subjective poverty is for persons living alone, whether young or old, single-parent households and households with numerous children Some individuals feel poor when they feel excluded from the social, economic and cultural context of origin This means that the welfare system isn’t able to guarantee a level of services that permits individuals to not feel too deprived compared to others; it isn’t able to guarantee securities in case of unexpected events, making those who don’t have the support of an informal network feel vulnerable, and worsening their quality of life. No, I think, policy makers cannot neglect who feels to be poor
Deprivation indicators are useful to design policies too • The deprivation indicators help highlight hardship dimensions that could be hidden when we only consider the monetary indicators. At the moment some material deprivation indicators are included in EU-SILC lists of variables to be collected each year. • For example could not afford (if wanted to): • one week annual holiday away from home, • a meal with meat, chicken or fish every second day, • Afford to: • keep home adequately warm, • a dentist visit, • a visit of an other kind of specialist, • Enforced lack of: • Colour TV, Telephone (including mobile phone, computer, washing machine), personal car ecc some characteristic of dwelling, arrears, ability to make ends meet, capacity to face unexpected financial expenses, financial burden of the total housing cost, financial burden of the repayments of debts form hire purchase or loans.
Different combinations of hardship factors In Italy a cluster analysis using monetary and not monetary indicators inferable from the EU-SILC survey, has showed 7 groups of households strongly characterized from different combination of hardships factors. It’s particularly interesting the case of 2 groups who don’t position themselves under the poverty threshold, but they still suffer a hardship situation, The first group is composed by 7,5 percent of the households. It groups together young households burdened by the housing expenses in particular by house mortgage. It’s usually young households, at the beginning of their lifecycle, often with at least one child under 18. Although these households are not poor in monetary terms, they show the hardship related to buying a home in a country where, practically, the alternative of paying a rent is non-existent.
Different combinations of hardship factors (2) The second group consists of 10.4% of households. They arrive ‘with great difficulties’ at the end of the month, can’t manage to save and in some cases have to make a dent into their patrimony or get into debt. Among these households we register the highest quote of those who could not afford an un-expected expense of 700 euros, or that haven’t had the money, at least in one occasion, to buy clothing. In spite of the difficulties met, the greatest part of these households aren’t positioned under the poverty threshold, but considers the expenses for housing a heavy load. Besides, a high quota lives in houses in not a perfect state (with problems of humidity, damaged shutters, etc). Both the groups of households suffer a hardship situation related to housing: they are both targets of possible policies aiming at avoiding that hardship become poverty.
Have official statistics a role in measuring subjective indicators? Someone suggests a role division between official statistics who should produce objective indicators and private or others institutions who should produce subjective indicators. I think it’s unacceptable. If National statistical institutes have to produce indicators useful for policies, and policies need both objective and subjective indicators….. …consequently, National Statistical Institutes have to produce all kinds of indicators. But if we agree with these considerations, we must consider the complexity of a subjective indicator. It should be considered complex as the objective one. It’s not easier to measure a subjective indicator.
Which scale? When we adopt, for instance, satisfaction indicators, we should be careful about the adopted scale. A score scale or a verbal scale? How many possible items should be considered? if we consider the item ‘I don’t know’ or not, the results we will obtain will be different. An example is given by the question on the perception of health conditions. In the Italian Multipurpose Survey at the beginning of the ‘90s, we started using a 5 score scale, while later Istat adopted a verbal scale with 5 items. The results are deeply different, because it’s difficult to declare ‘I feel very well’ compared to scoring 1 as an answer. The use of the verbal scale has reduced the number of people that declared themselves in a very good health condition.
Satisfaction and expectations Istat, in the Multipurpose survey ‘Aspects of daily life’ has inserted a set of questions about the satisfaction of services of public use with a verbal scale with 4 items. The results are very interesting, the changes in the opinions effectively correspond to an objective situation, but a deeper analysis, especially of the territorial differences of satisfaction, have demonstrated the necessity to also measure the expectations towards services. From the territorial comparisons critical opinions have been drawn also in the regions where there had been more advances in the services’ progress. A careful measure of the expectations helps detect the effective territorial differences. This is the reason why Istat is planning a new survey about services where expectations and satisfaction are both investigated.
More attention for methodological aspects These are only some examples on the necessity of deepening the methodological aspects of the subjective indicators. It is fundamental that National Statistical Institutes develop a new quality of life approach in statistics, using both subjective and objective indicators. I think that many NSI use subjective indicators. It’s important to know which indicators are used by National Statistical Institutes in the world We have to invest on methodologies for the construction of subjective indicators. Subjective indicators have to be treated in the same way as objective indicators: we need recommendations at an international level, handbooks which focus on the scales and on the wording of the questions, also in order to give a chance for international comparability. In sum, we need to start a process of innovation and harmonization. If we don’t invest in methodology, the combination with the subjective indicators would be only apparent and the quality leap in the statistics production, which is today necessary beyond GDP wouldn’t be possible.